hidden
-

Adding
Private Credit
To Your Portfolio
The highest risk-adjusted return over the last 20 years
What is Private Credit?
(Private Debt, Private Credit, and Direct Lending are used interchangeably and broadly refer to the same asset class: loans to private corporations)
- Private Credit is a debt investment, similar to corporate bonds or fixed income.
- Like a bank, as investors we will loan money to a corporation, and collect an interest rate on that loan.
- The return is effectively the rate of interest we charge, less any losses due to defaults.
- Many of the loans are made to Private Equity owned companies.
- 30 years ago, regional banks did most of this lending to private US corporations.
- But in 2025, over 90% of corporate buyout loans to US middle market firms are made by Private Credit lenders.4
- The Private Credit market was estimated at $2.0 trillion in 2025. 5
So, why invest in Private Credit?
Private Credit is the only asset class to offer10% returns and single-digit max loss. 6
Replace your Bonds with Private Credit
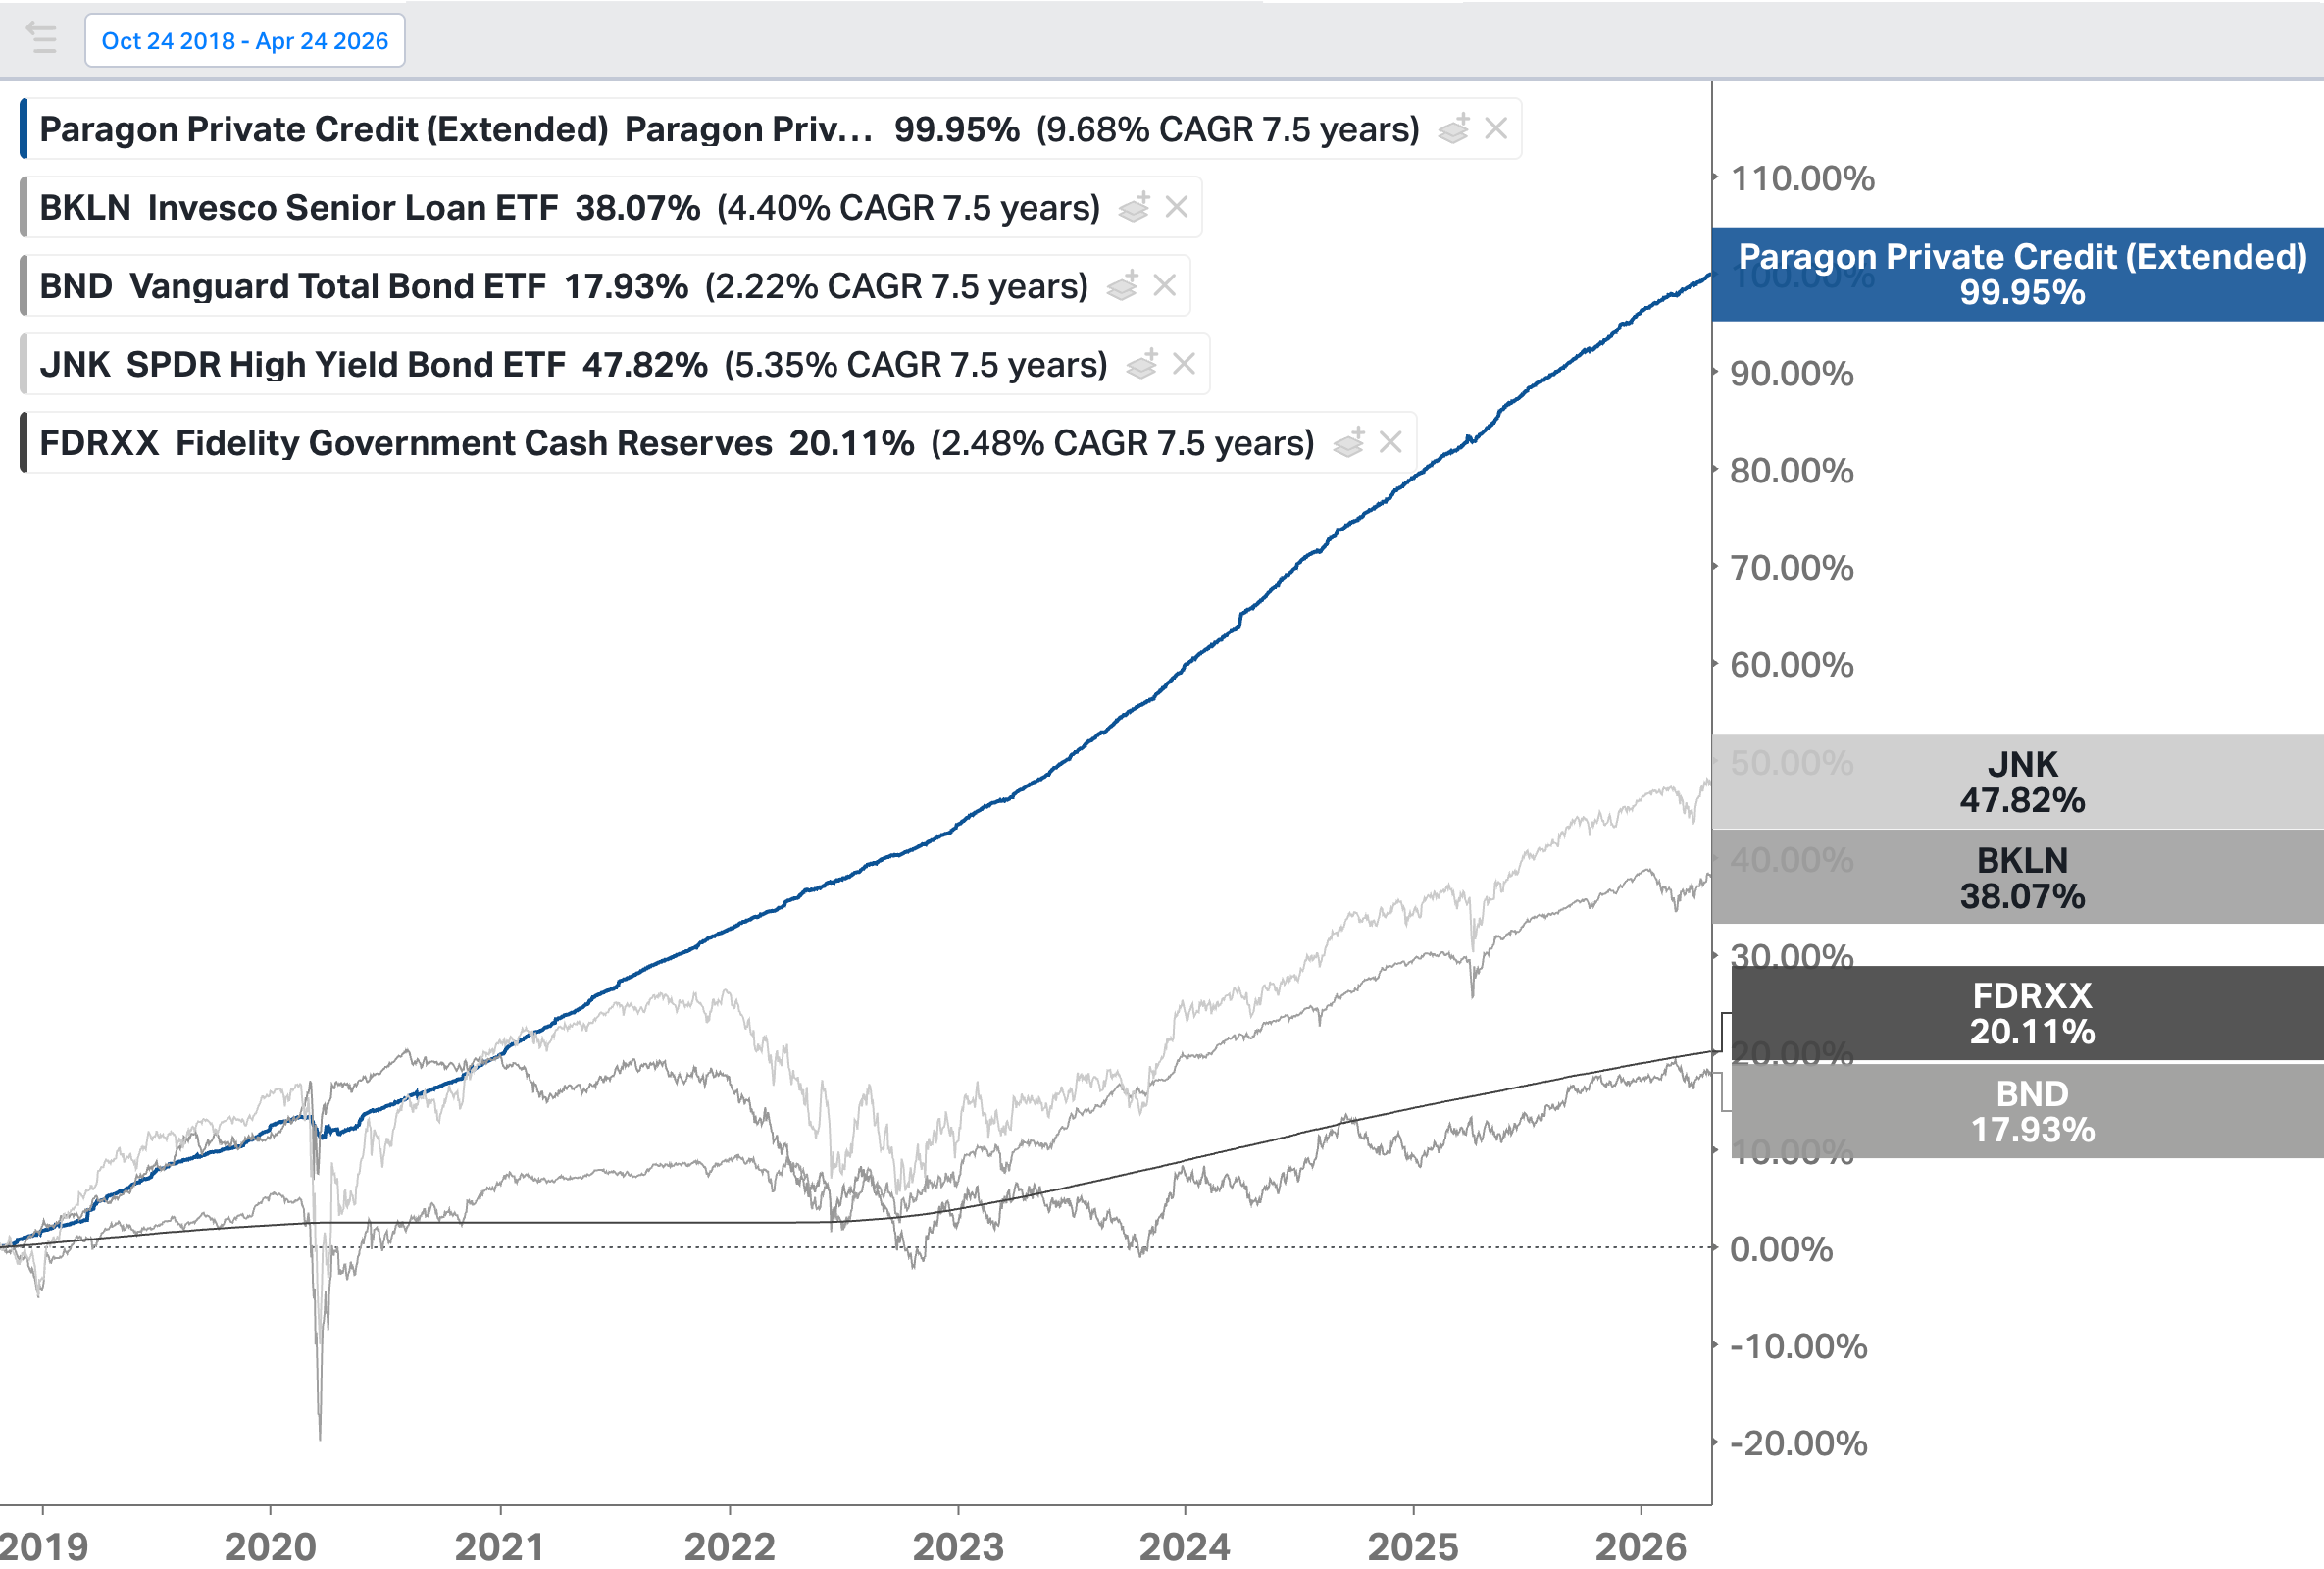
Source: Koyfin.com, retrieved 04/24/2026
Note: This Private Credit portfolio data includes interval funds used in the model portfolio at our CIO's prior firm in 2018, which were carried over to Paragon in 2020.
Trailing 6-year statistics (11/1/2019 - 10/1/2025)
| Asset | Annualized Return | Max Loss | Volatility | Stock Beta |
|---|---|---|---|---|
| Private Credit | 10.0% | -3.9% | 1.8% | 0.05 |
| Bank Loans | 4.8% | -24% | 6.4% | 0.23 |
| High Yield Bonds | 4.3% | -22.8% | 6.9% | 0.65 |
| Core US Bonds | 0.8% | -8.1% | 6.0% | 0.17 |
| Treasury Bills | 2.6% | 0.0% | 0.6% | 0.00 |
| Money Market | 2.5% | 0.0% | 0.6% | 0.00 |
Sources: Private Credit: CCLFX mutual fund; Bank Loans: BKLN; High Yield Bonds: JNK; Core US Bonds: AGG/BND; Treasury Bills: VBIL/BIL; Money Market: FDRXX.
Private Credit is the all-weather asset class
Private Credit
Cliffwater Direct Lending Index
(CDLI)
Global Financial Crisis
maximum loss *
- 9.55% 20-year annualized return **
- Negative return for 12 months
- Interest payments reduced by 10% during the crash
- Quarterly redemptions and rebalancing
* quarterly max drawdown
(06/30/2008 - 12/31/2008)
** 12/31/2004 - 12/31/2024
High Yield Bonds
Global Financial Crisis
maximum loss *
- 4.26% 20-year annualized return **
- Negative return for 15 months
- Interest payments reduced by ~20% ***
- Daily liquid and rebalancing
* quarterly max drawdown
(09/30/2007 - 03/31/2009)
** 12/31/2004 - 12/31/2024
*** Two-year cumulative default rate of 19.5% (2008-2009)
U.S. Core Bonds
iShares Core US Aggregate Bond
(AGG)
Global Financial Crisis
maximum loss *
- 2.90% 20-year annualized return **
- Negative return for 2.5 months
- -12.8% maximum loss (daily) ***
- Daily liquid and rebalancing
* quarterly max drawdown
(03/31/2008 - 09/30/2008)
** 12/31/2004 - 12/31/2024
*** Daily max drawdown 09/09/2008 - 10/10/2008
Private Credit
Cliffwater Corporate Lending Fund (CCLFX) ***
COVID-19 Pandemic
maximum loss *
- 9.55% 20-year annualized return **
- Negative return for only 3 months (2020)
- Quarterly redemptions and rebalancing
* Daily max drawdown (02/27/2020 - 03/25/2020)
** 20-year period: 12/31/2004 - 12/31/2024
*** CCLFX was held in Paragon client accounts in 2020.
Private Credit
Cliffwater Corporate Lending Fund (CCLFX) ***
Rising Interest Rates
maximum loss *
- 6.53% total return in 2022
- 9.55% 20-year annualized return **
- Negative return for only 1 month (2022)
- Quarterly redemptions and rebalancing
* Daily max drawdown
(5/5-5/19, 9/23-9/29)
** 20-year period:
12/31/2004 - 12/31/2024
*** CCLFX was the highest volatility, lowest return Private Credit fund we held in 2022. Our Private Credit model (3 funds) had an 8.10% return with -0.1% max drawdown in CY 2022
US Stocks
Rising Interest Rates
maximum loss *
- -18.4% total return in 2022
- 10.25% 20-year annualized return **
- Negative return for 23 months
(2022-2023) *** - Daily liquid and rebalancing
* Daily max drawdown
(01/04/2022 - 10/12/2022)
** 20-year period:
12/31/2004 - 12/31/2024
*** Negative return:
01/04/2022 - 12/13/2023
High Yield Bonds
Rising Interest Rates
maximum loss *
- -12.2% total return in 2022
- 4.26% 20-year annualized return **
- Negative return for 29 months
(2022-2024) *** - Daily liquid and rebalancing
* Daily max drawdown
(12/28/2021 - 09/27/2022)
** 20-year period:
12/31/2004 - 12/31/2024
*** Negative return:
12/27/2021 - 05/31/2024
U.S. Core Bonds
iShares Core US Aggregate Bond
(AGG)
Rising Interest Rates
maximum loss *
- -13.0% total return in 2022
- 2.90% 20-year annualized return **
- Negative return for over 63 months
(2020-2025) - Daily liquid and rebalancing
* Daily max drawdown (03/06/2020 - 10/20/2022)
** 20-year period: 12/31/2004 - 12/31/2024
*** Negative return:
08/04/2020 - Present
(as of 10/27/2025)
Cumulative return of -1.90%
Private Credit
Cliffwater Corporate Lending Fund (CCLFX) ***
Trump Tariff Tantrum
maximum loss *
- 9.55% 20-year annualized return **
- Negative return for only 15 days (2025)
- Quarterly redemptions and rebalancing
* Daily max drawdown (04/02/2025 - 04/07/2025)
** 20-year period: 12/31/2004 - 12/31/2024
*** CCLFX is the highest volatility, lowest return Private Credit fund we hold in 2025. Our Private Credit model (3 funds) had a -0.30% max drawdown in 2025 (YTD).
US Stocks
Trump Tariff Tantrum
maximum loss *
- 10.25% 20-year annualized return **
- Negative return for
4 months (2025) *** - Daily liquid and rebalancing
* Daily max drawdown (02/20/2025 - 04/08/2025)
** 20-year period: 12/31/2004 - 12/31/2024
*** Negative return:
02/20/2025 - 06/26/2025
High Yield Bonds
Trump Tariff Tantrum
maximum loss *
- 4.26% 20-year annualized return **
- Negative return for 3 months (2025) ***
- Daily liquid and rebalancing
* Daily max drawdown (03/03/2025 - 04/08/2025)
** 20-year period: 12/31/2004 - 12/31/2024
*** Negative return:
03/03/2025 - 05/27/2025
U.S. Core Bonds
iShares Core US Aggregate Bond
(AGG)
Trump Tariff Tantrum
maximum loss *
- 2.90% 20-year annualized return **
- Negative return for 4 months (2025) ***
- Daily liquid and rebalancing
* Daily max drawdown (04/04/2025 - 04/11/2025)
** 20-year period: 12/31/2004 - 12/31/2024
*** Negative return:
04/04/2025 - 07/28/2025
Replace your Stocks with Private Credit
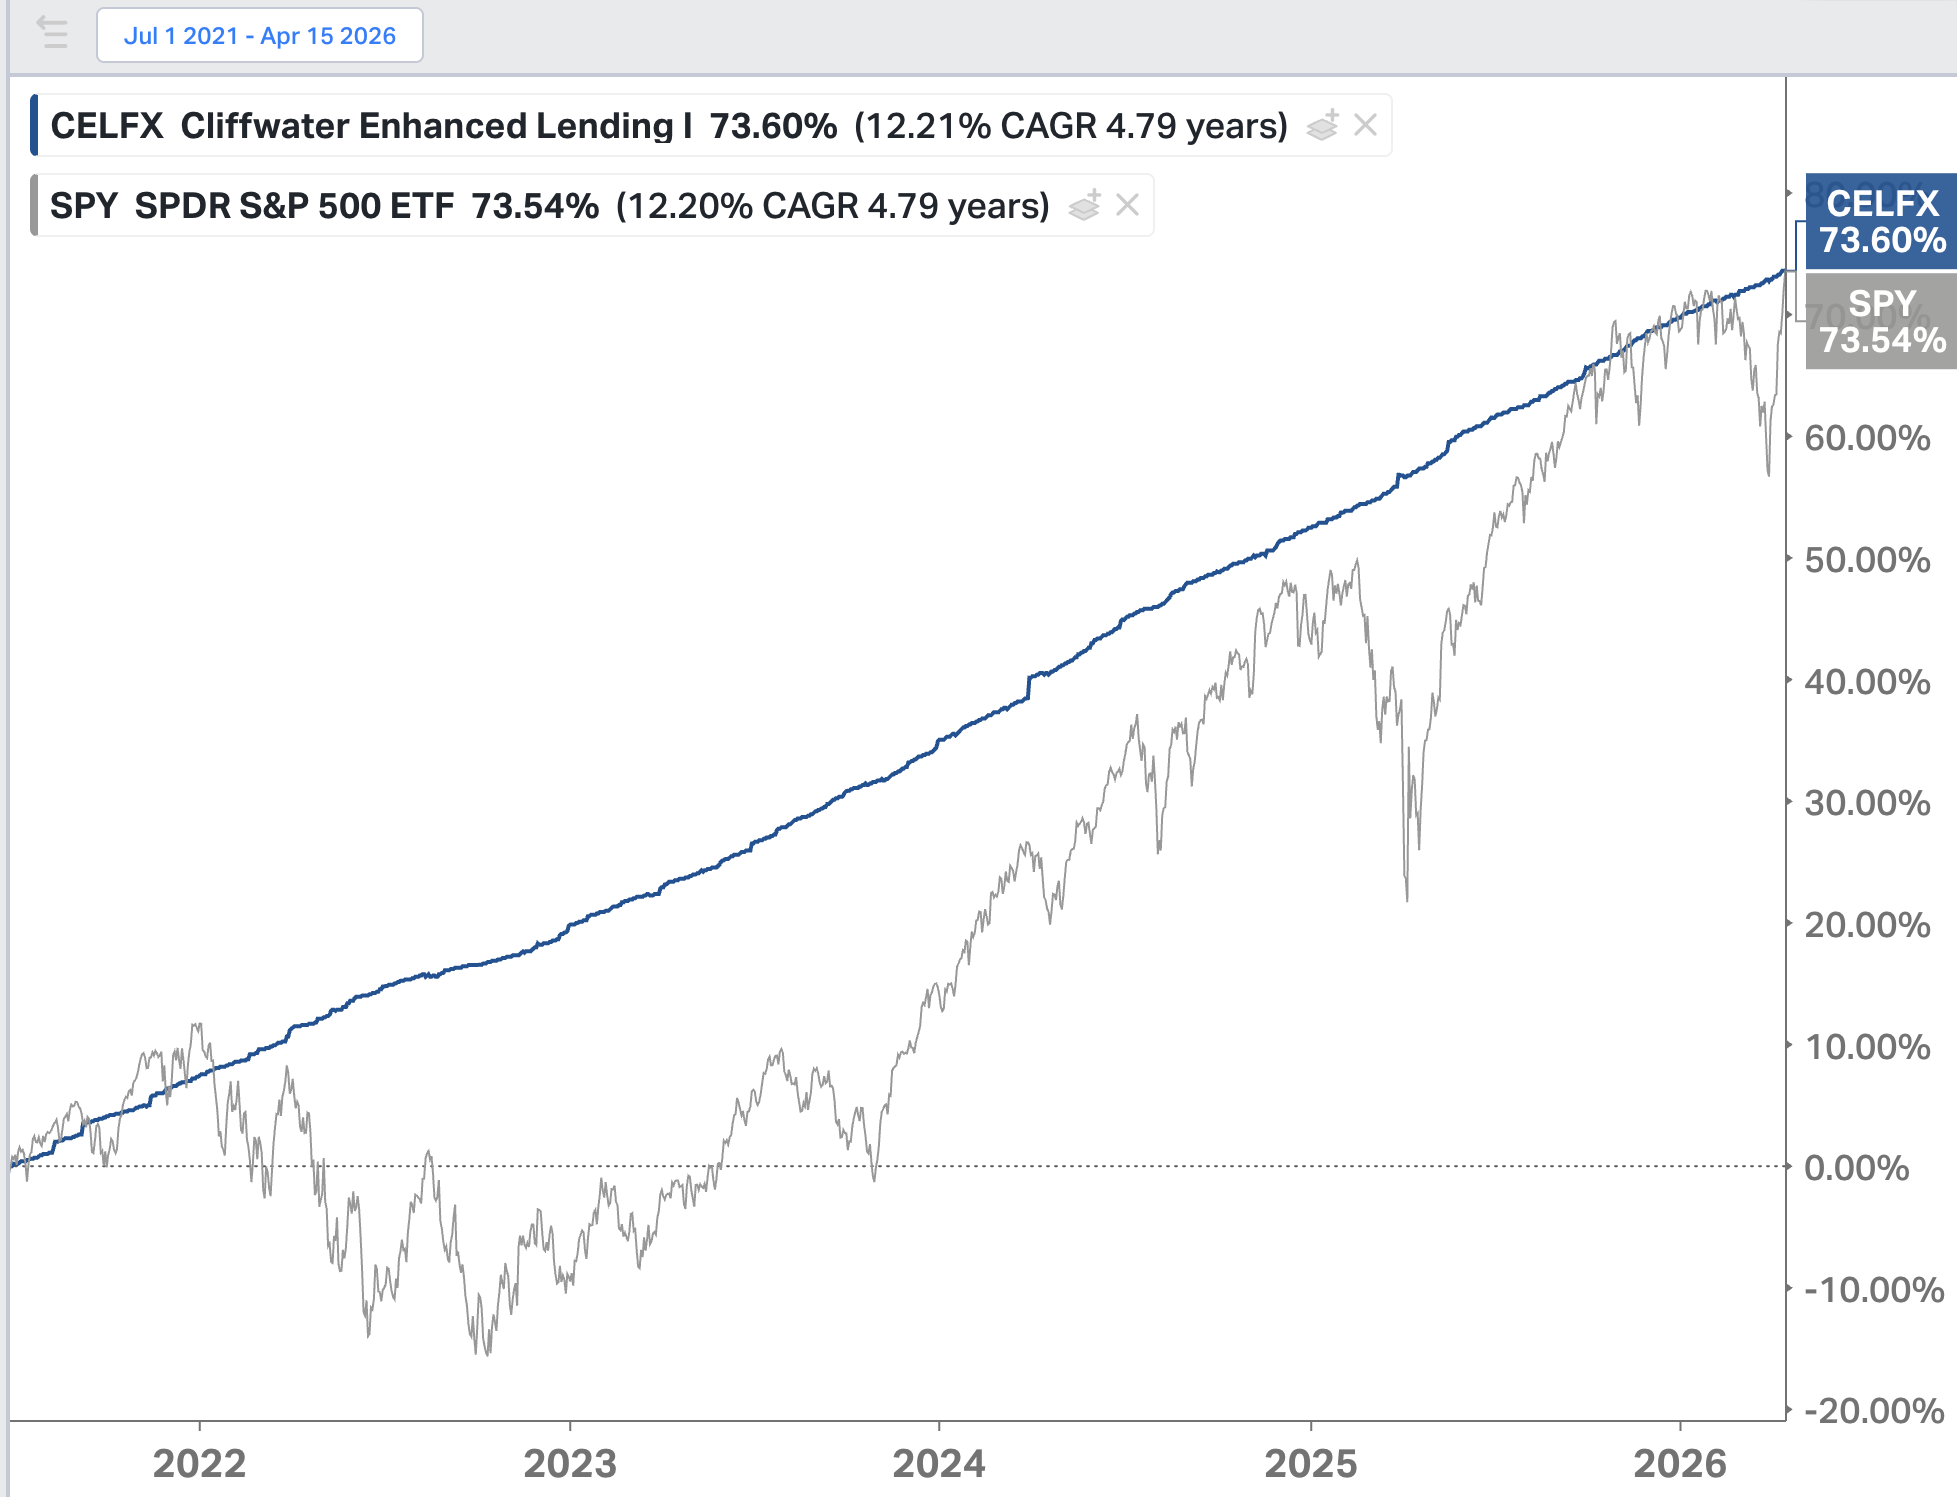
Source: Koyfin.com, retrieved 04/24/2026
US Stocks & Private Credit offer similar long-term returns, but with vastly different volatility
Since CELFX's inception on 7/1/2021, Private Credit has matched or outperformed the US stock market, while taking significantly less risk.
Private Credit: earnings growth not required for 10% returns
In order for stocks & equities to appreciate in value, the underlying companies need to grow profits. For debt-based investments like Private Credit, those factors largely don't matter. The bar is much lower: just make the interest payments and don't go bankrupt.
If a company's profits decline by 50%, that stock is likely to decline by 50%. If a company stops growing, that stock may decline by 50%. But even though that company is less profitable, or stops growing, it can likely still pay the interest due on its loans, and the Private Credit funds with exposure to the same company keep making their ~10% annually.
Private Credit offers equity-like returns and bond-like risk.
Private Credit provides stability
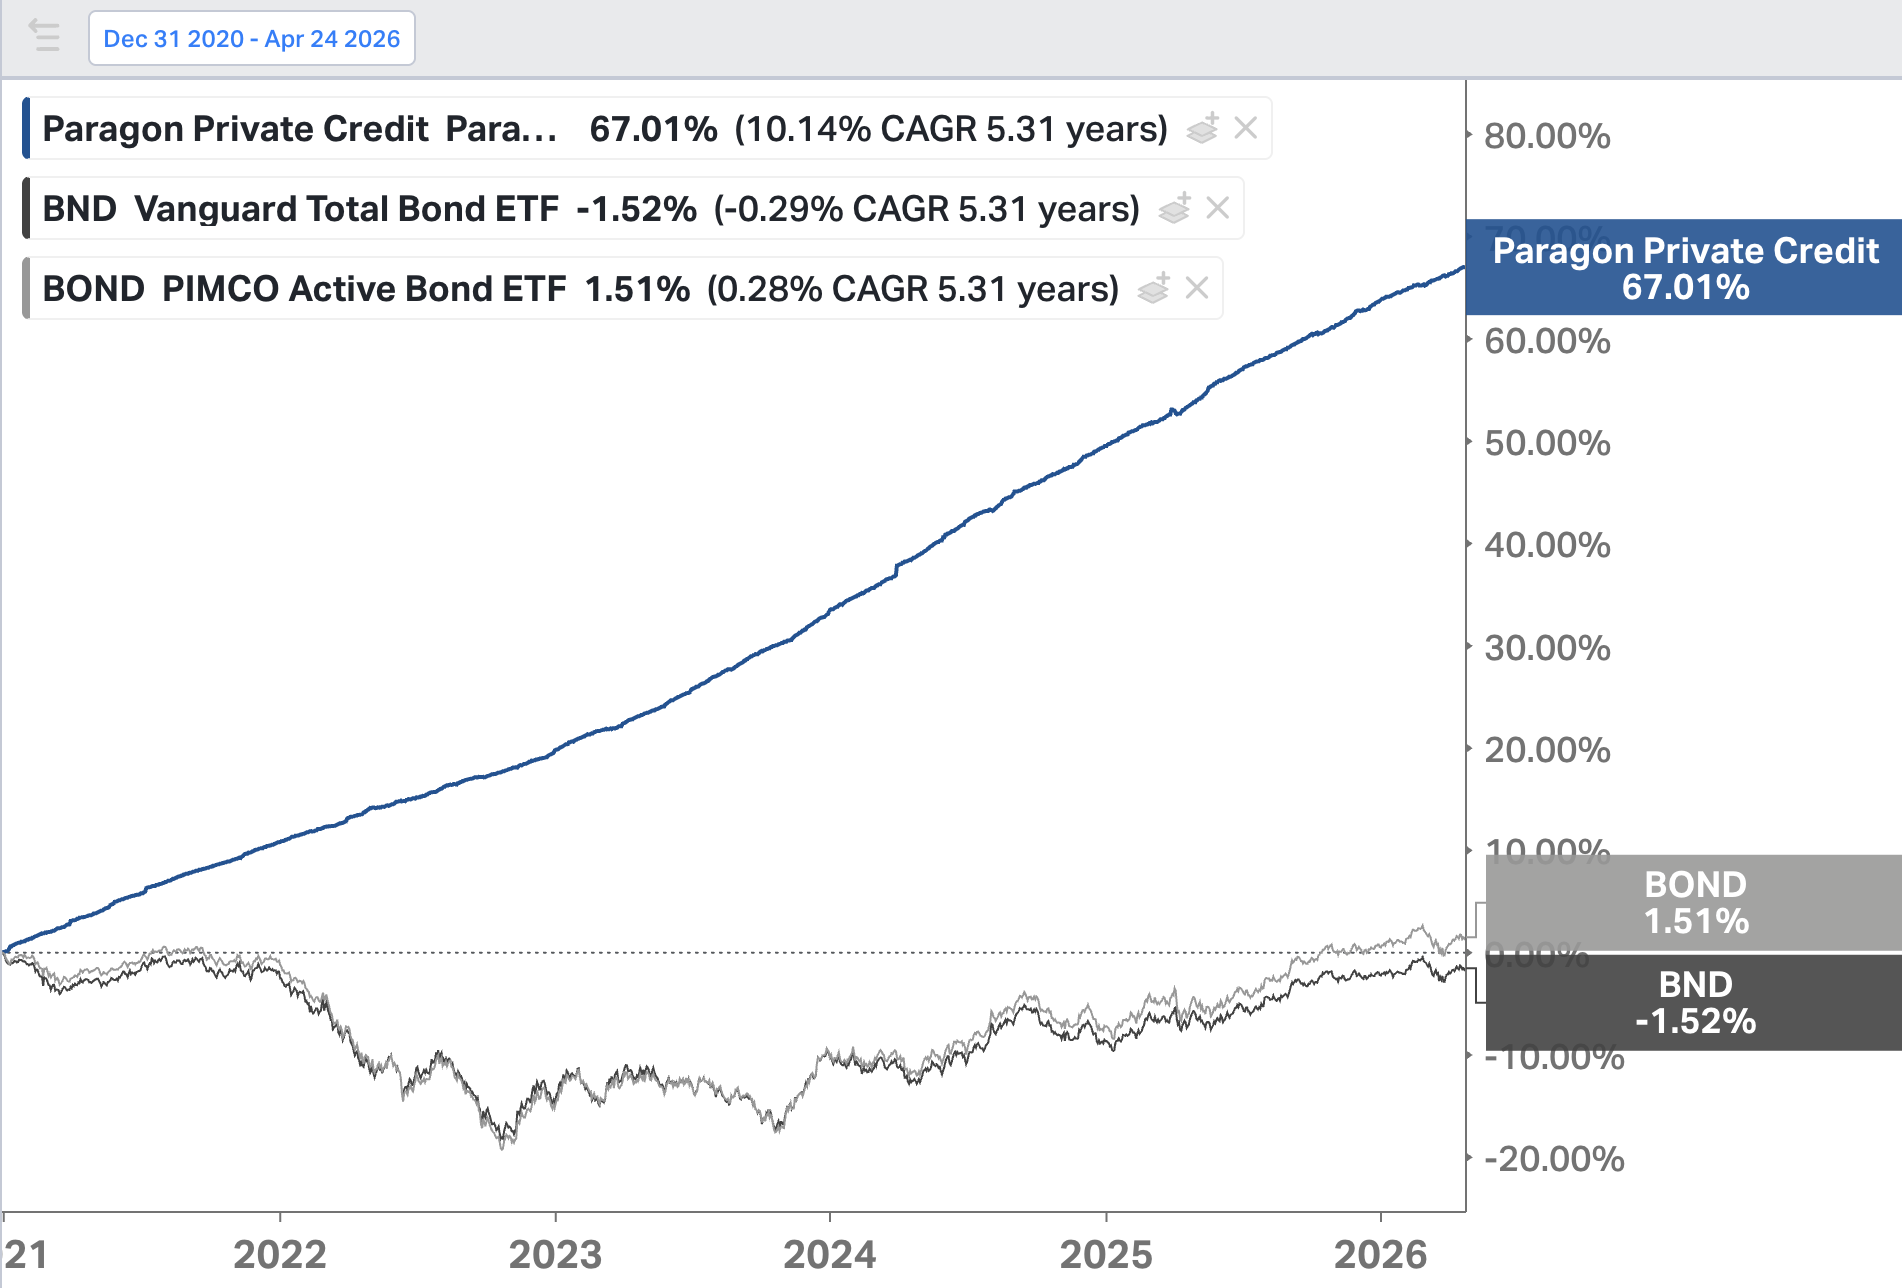
Source: koyfin.com Retrieved 04/24/2026
How is Paragon different?
Paragon and its partners spend hundreds of hours researching and performing due diligence on interval funds to establish high conviction in select Private Credit funds.
Some of our preferred Private Credit funds are restricted to ultra-wealthy clients, and would otherwise require a $10M minimum investment (e.g. CELFX, CCLFX), putting it out of reach for many individual investors. But Paragon clients can access these funds with a $100k minimum, as we have already met the $10M minimum for each fund.
Our value-add is transparent
- Increased Returns: Private Credit has historically outperformed public Bonds by +7.0% annually 1 over the last 20 years (12/31/2004-12/31/2024).
- Reduced Risk: In March 2020, during COVID, when most US stock indexes were down 30%-35% or more, our two preferred Private Credit funds were down only -3% and -4% 2. By complementing your stocks with private credit funds, you can expect to lower your portfolio volatility while still matching long-term equity returns.
- Quarterly Liquidity: Our Private Credit interval funds each offer quarterly liquidity. If invested across all three funds, clients have 12 different redemption dates throughout the year. 3
Better performance through independent research, deep due diligence, and exclusive access.

1. Returns by Asset Class: Public US Bonds: 3% [Core US Bond; AGG] (Period: 12/31/2004 - 12/31/2024), Private Credit: 10% [Cliffwater Direct Lending Index, CDLI] (Period: 12/31/2004 - 12/31/2024). Returns rounded to the nearest whole number.
2. Max drawdown figures are quarterly for all asset classes. Sources: Cliffwater Direct Lending Index (CDLI) had a -7.8% maximum quarterly drawdown in Q4 2008.
3. Private Credit funds such as CCLFX and CELFX have a $10M minimum to access their fund. Most Private Credit semi-liquid interval funds offer quarterly redemptions, subject to proration if total redemption demand exceeds 5% of fund AUM on any date.
4. "Around 90% of US mid-market buyouts are financed by private credit" Source: JPMorgan
5. The Private Credit market was estimated at $3.0 trillion in 2025. Source: Morgan Stanley Investment Management (October 2025)
6. Since inception, the CDLI has delivered an annualized total return of 9.55%. Rounded to closest integer (10%). Source: Cliffwater Direct Lending Index (CDLI).
7. Private Credit is the only asset class to offer 9.55% average returns and sub-3.0% volatility Source: Cliffwater.com Resources.
8. As of publication date (01/31/2026), both Paragon advisors (IARs) were invested in the recommended Private Equity and Private Credit funds at total allocations 82% and 74% of portfolio for each advisor, demonstrating significant personal alignment with recommendations given to clients. The remaining portfolio for both advisors is invested primarily in U.S. stocks and public equities, which is also aligned with the Paragon Model Portfolio, again demonstrating a high degree of alignment between advisor recommendations and our personal investments.
All investing involves risk, including the possible loss of money you invest, and past performance does not guarantee future performance. Historical returns, expected returns, and probability projections are provided for informational and illustrative purposes, and may not reflect actual future performance. Please see our Full Disclosure for important details.
Copyright © Paragon Investing. All Rights Reserved. Privacy Policy. Terms of Use. Form ADV and Supplement. RIA and IAR Registration.