Access to Private Assets
Paragon Investing provides access to Private Equity and Private Credit interval funds, the same investments that are owned by ultra-wealthy families, endowments, pensions, and other sophisticated investors with $100M+.


Invest alongside ultra-wealthy families, large pensions, and billion-dollar university endowments. Harvard, Princeton, Michigan, and other successful endowments invest up to 80% of their portfolios into alternative assets such as private equity, venture capital, and private credit. They invest only ~20% of their portfolios into traditional stocks and bonds (as of June 30, 2025). 7
Paragon provides access to top-quartile Private Equity & Private Credit interval funds with waived investment minimums. These funds would otherwise have minimums of $10 million to $25 million per fund. 1
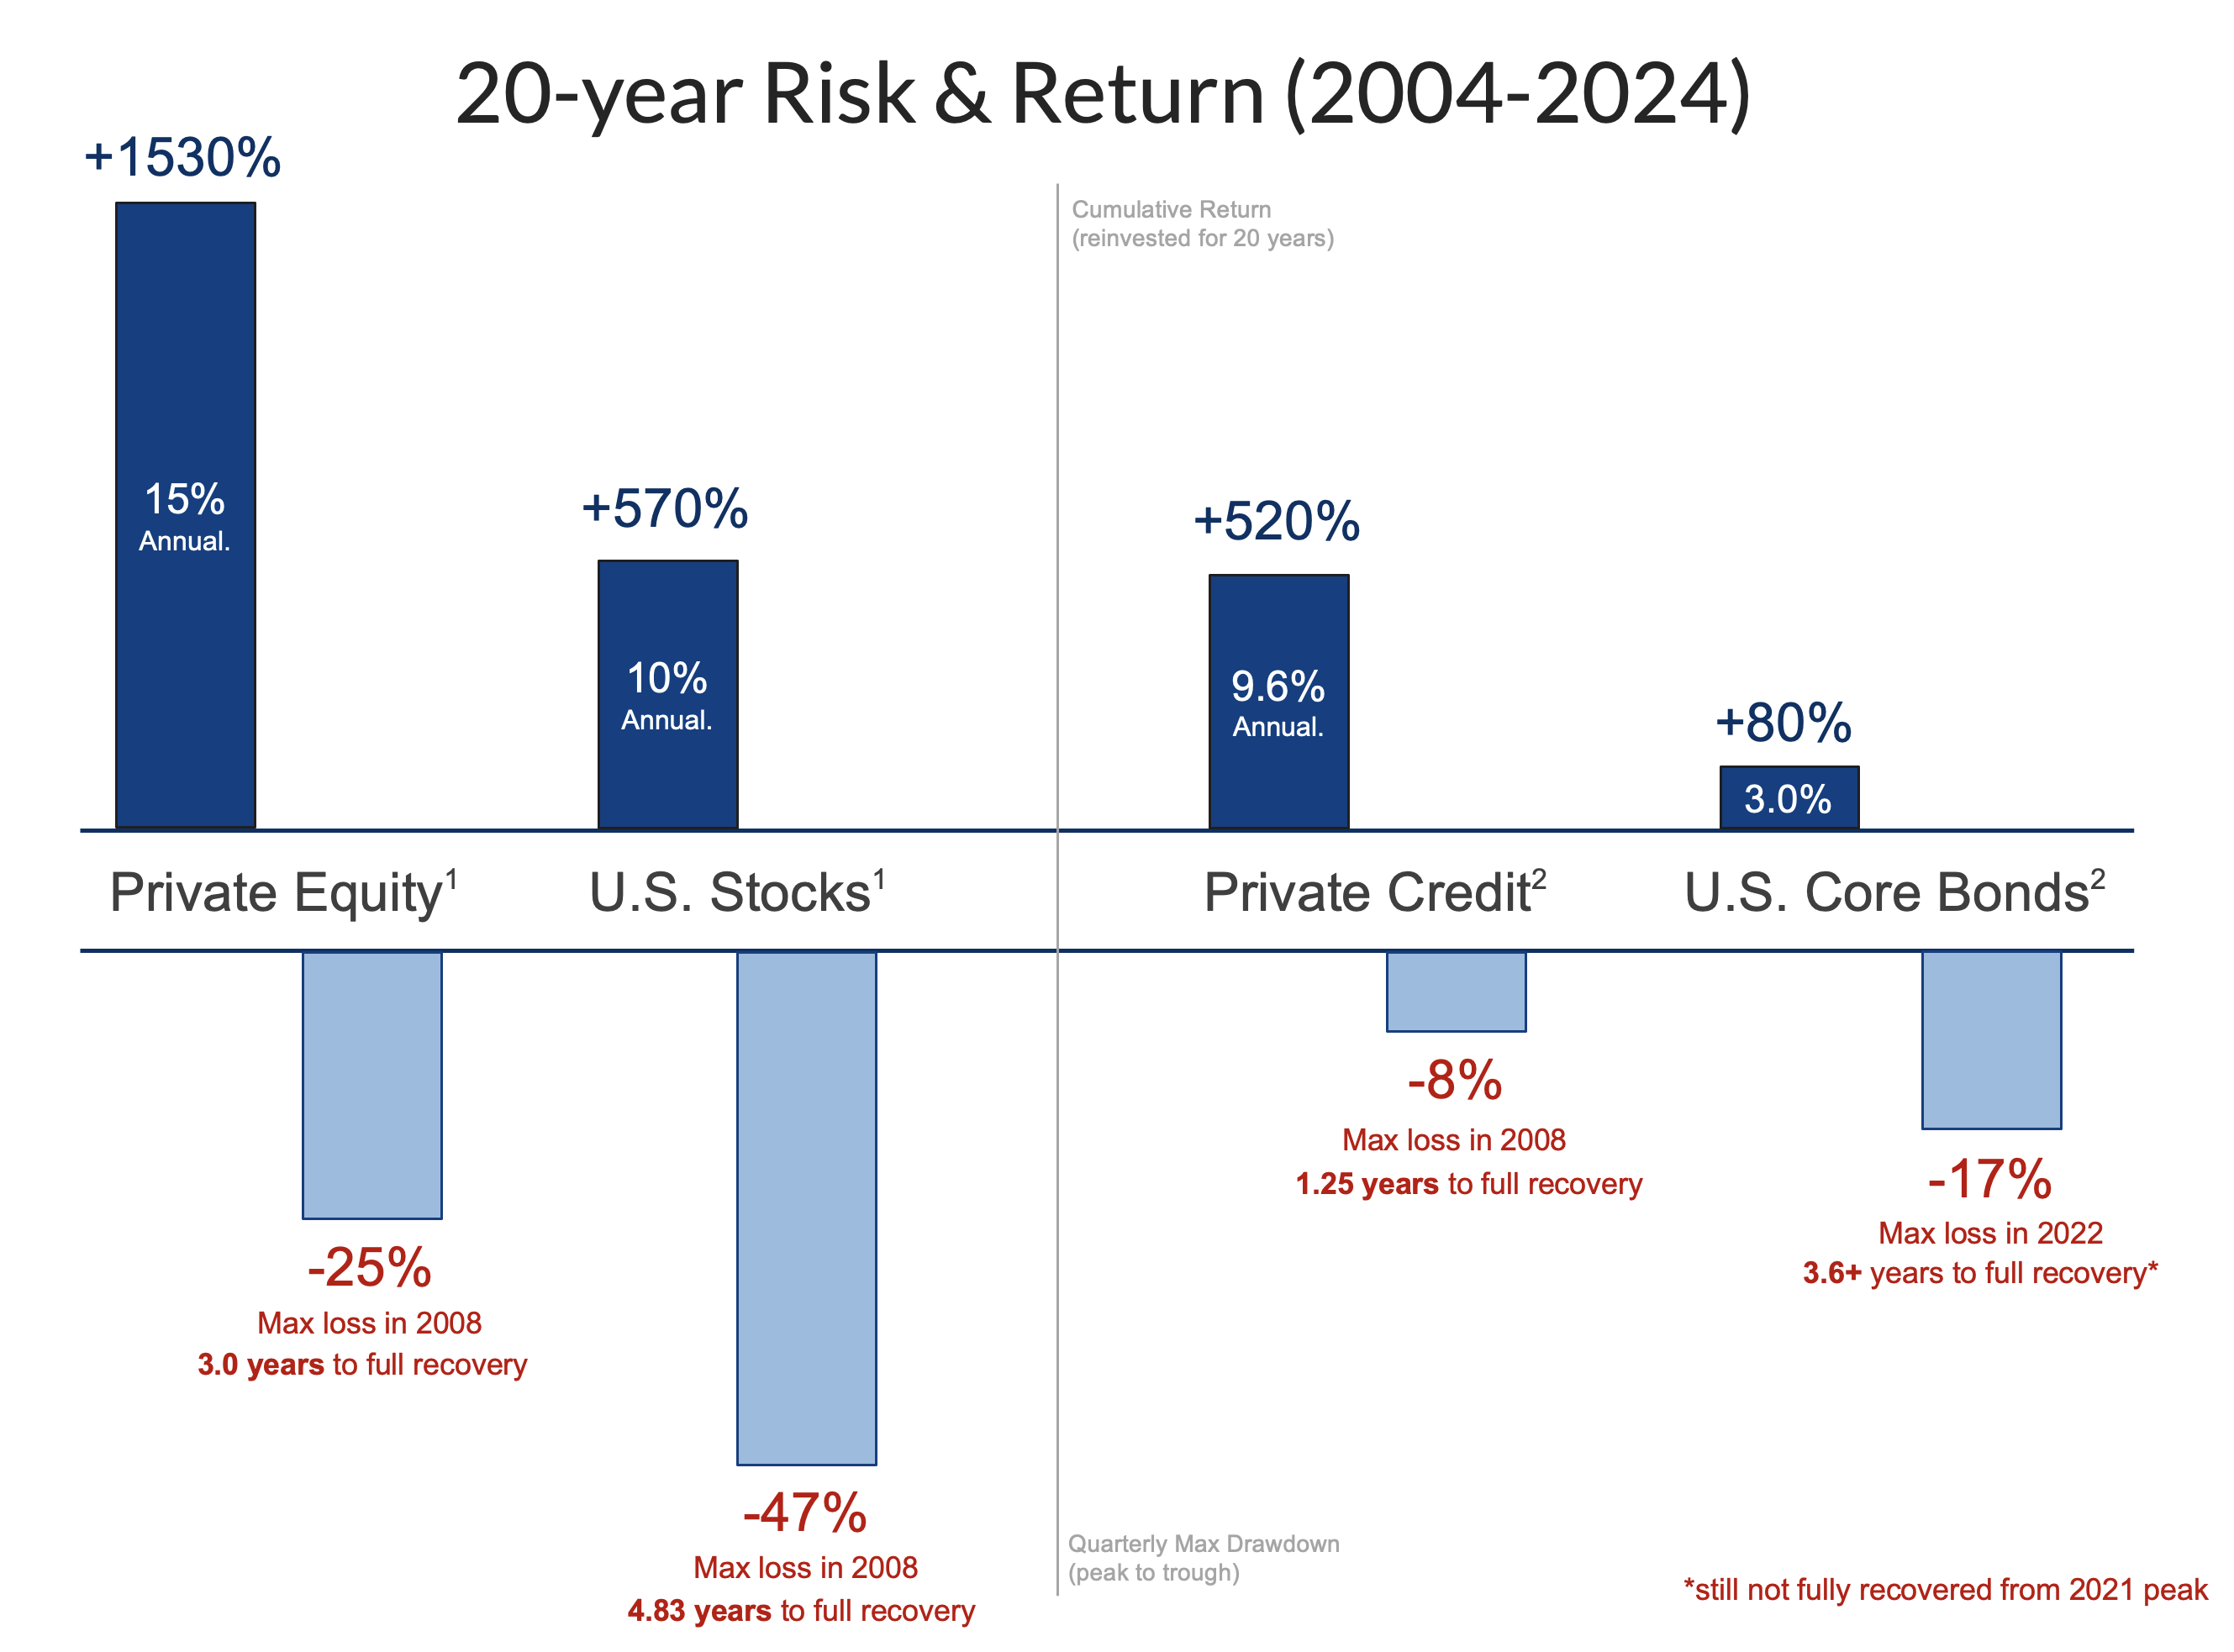
Over the last 20 years (2005-2024), Private Equity has returned 15% annually, while public U.S. Stocks have returned only 10% annually.
--> Private Equity has outperformed public stocks by +5% per year. 2
Over the last 20 years (2005-2024), Private Credit has returned 10% annually, while public U.S. Bonds have returned only 3% annually.
--> Private Credit has outperformed public bonds by +7% per year. 3
Five years ago, gaining access to private investments was difficult. Most funds were only available via limited partnership (LP) deals with high minimums and extended lock-up periods, not suitable for most investors.
Today, Paragon clients can invest in Private Equity & Private Credit via interval funds (mutual funds) with ticker-symbol execution, offering quarterly liquidity, 4 and waived minimum investment. 1 No capital calls, no waiting period, your money is 100% invested the next day.
You invest in what we're invested in. Paragon advisors are invested alongside our clients in the same funds. 8
Paragon Investing was launched in 2020
and is currently growing AUM +50% annually
exclusively via client referrals. (June 2026)
We remain focused on providing access to attractive private market investments for friends, family, and extended networks.
Paragon 60/40 Model Portfolio vs Large-Firm 60/40 Funds
Since Inception (12/31/2020 - 04/15/2026)
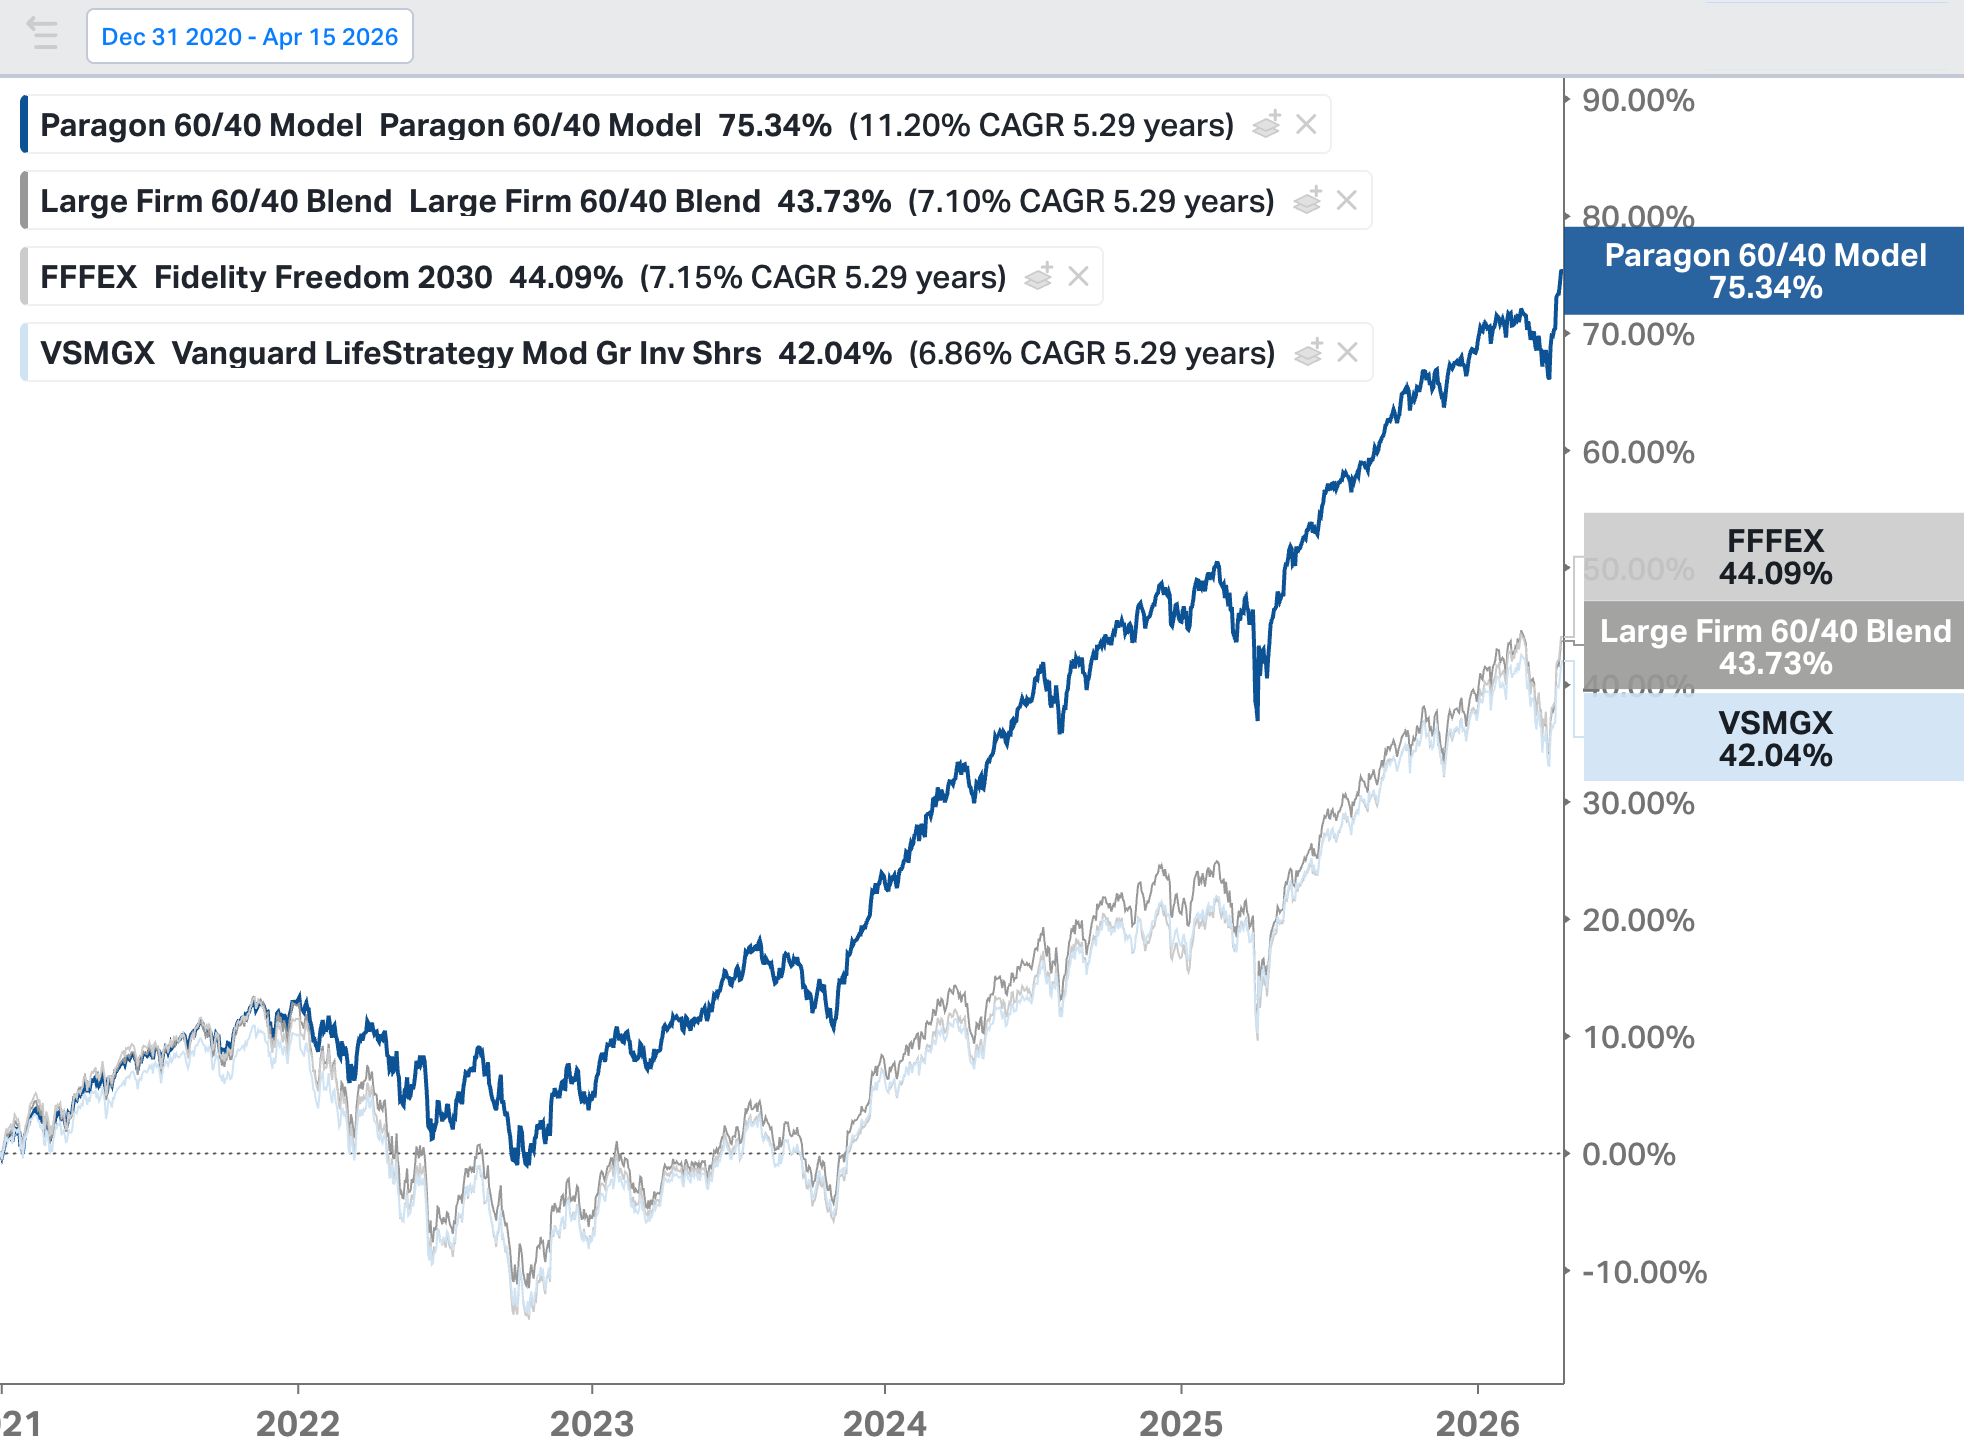
Source: Koyfin.com, retrieved 04/15/2026
All of the above funds & composites target 60% of holdings in stocks/equity, and 40% of holdings in bonds/fixed income.
Paragon 60/40 targets the same level of risk, and includes 40-60% of portfolio in semi-liquid Private Equity & Private Credit. 6
Paragon's 60/40 Model Portfolio has outperformed every major 60/40 fund and 2030 target date fund since our inception in late 2020. Paragon has outperformed the average Large Firm 60/40 Fund by +4.1% annualized and +31% total return (+75% vs +44%) over the last 5.3 years. The 2030 target date fund is representative of the default investment option in the average 401(k) or equivalent employer retirement plan.
In addition to achieving higher returns, we did it with less risk...
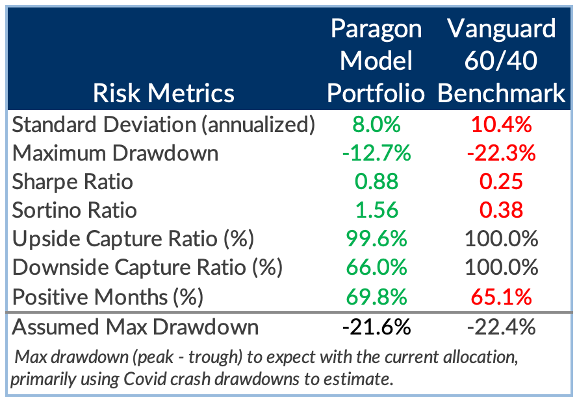
Since late 2020, Paragon's 60/40 Model Portfolio has offered lower risk metrics across the board, compared to the Vanguard 60/40 (VSMGX, above). Perhaps most importantly, we were able to reduce the portfolio's max loss (max drawdown) by nearly half (-12.7% vs -22.3%).
With an upside capture ratio near 100%, we equal-performed in up markets.
And with a downside capture ratio below 70%, we significantly reduced losses in down markets.
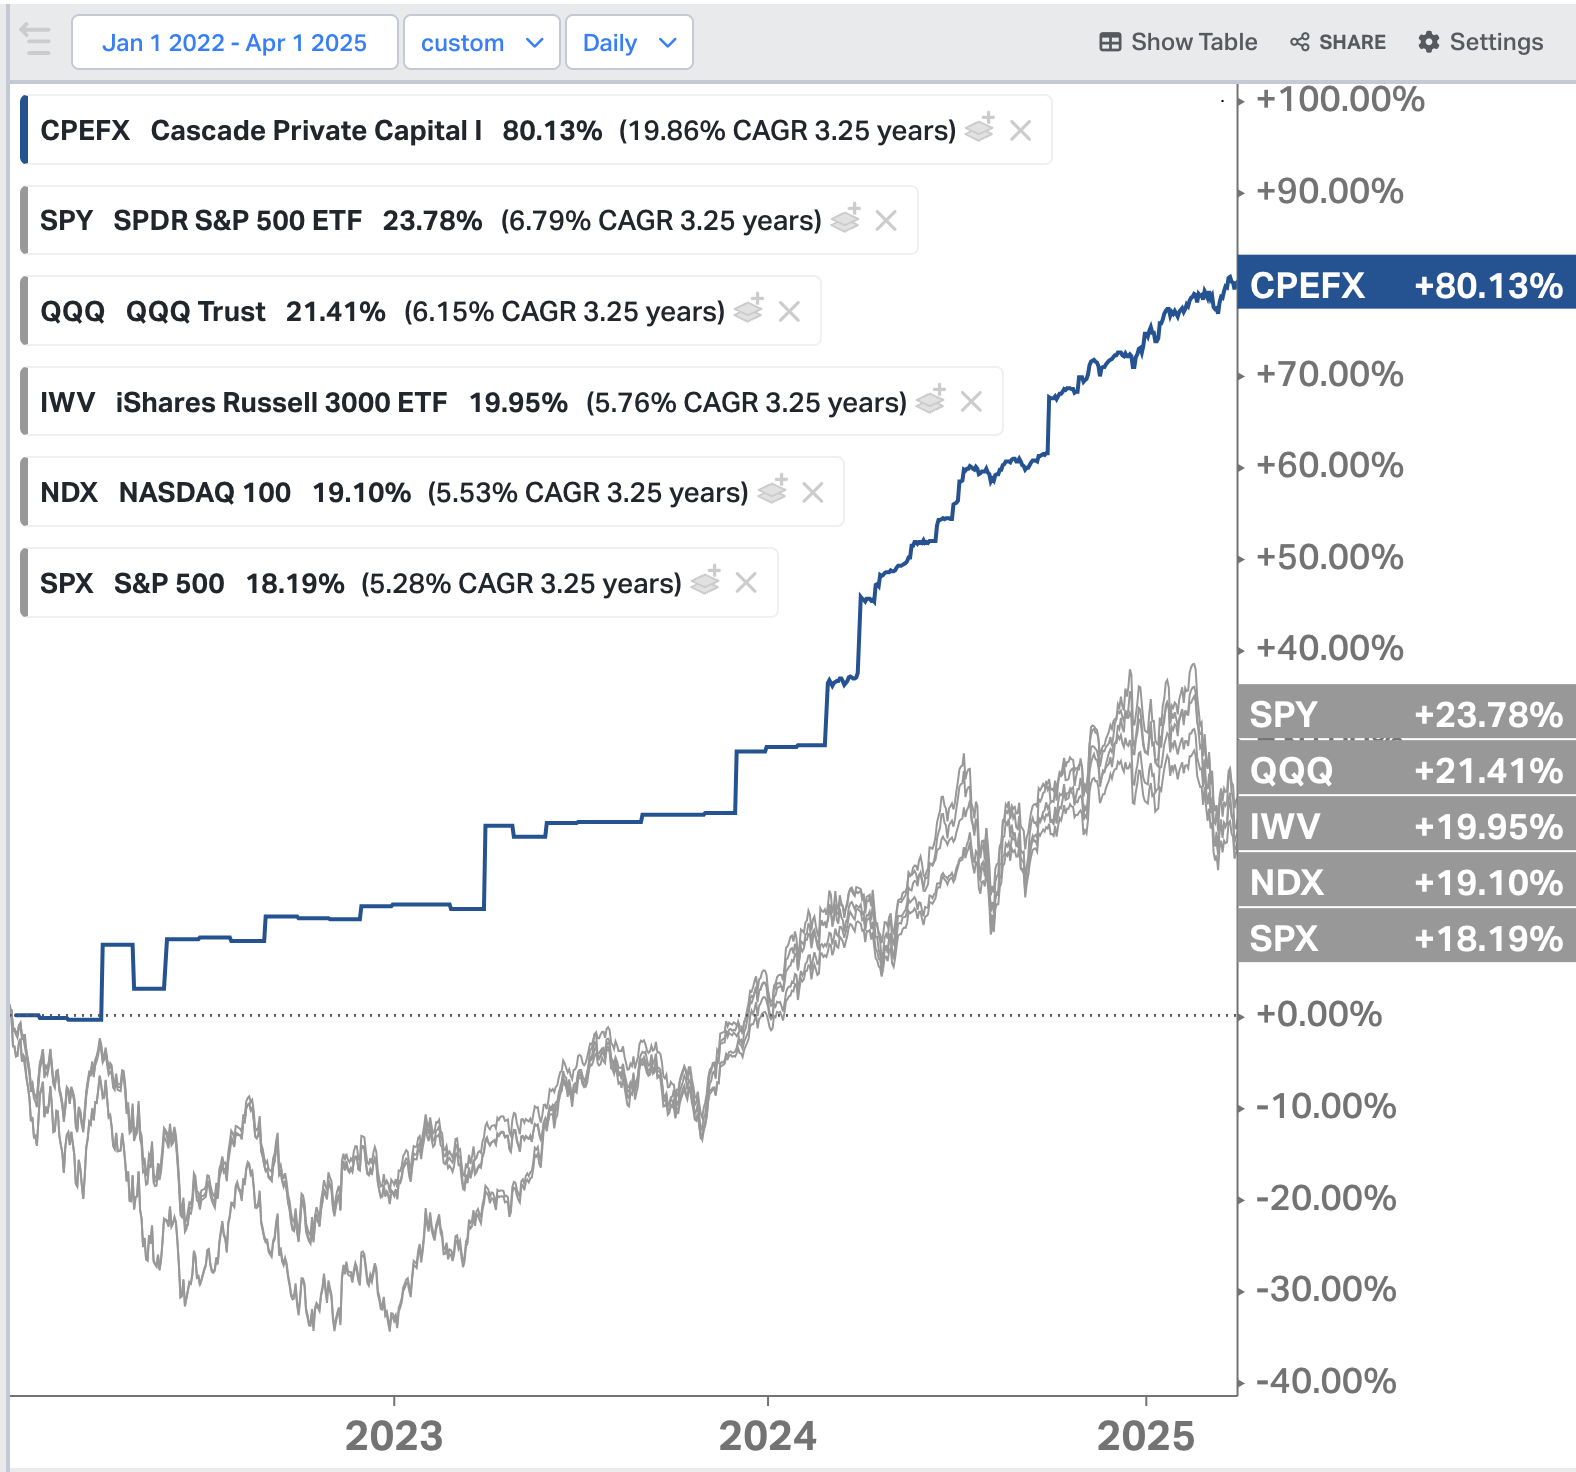
Private Equity
Over the last 20 years, Private Equity has outperformed US stocks by +5% per year, nearly tripling the total return during that 20 year timeframe (1536% return vs 572% return). 2 More impressive, that excess return was not achieved by taking more risk. In fact, Private Equity has historically exhibited half the risk of public U.S. Stocks. During the Great Financial Crisis in 2008, U.S. Stocks had a quarterly max drawdown of -47%, while Private Equity had a quarterly max drawdown of only -25%. 5
From 2005-2024, nearly triple the overall returns, with around half the risk of loss in the largest crash.
Learn More About Private Equity
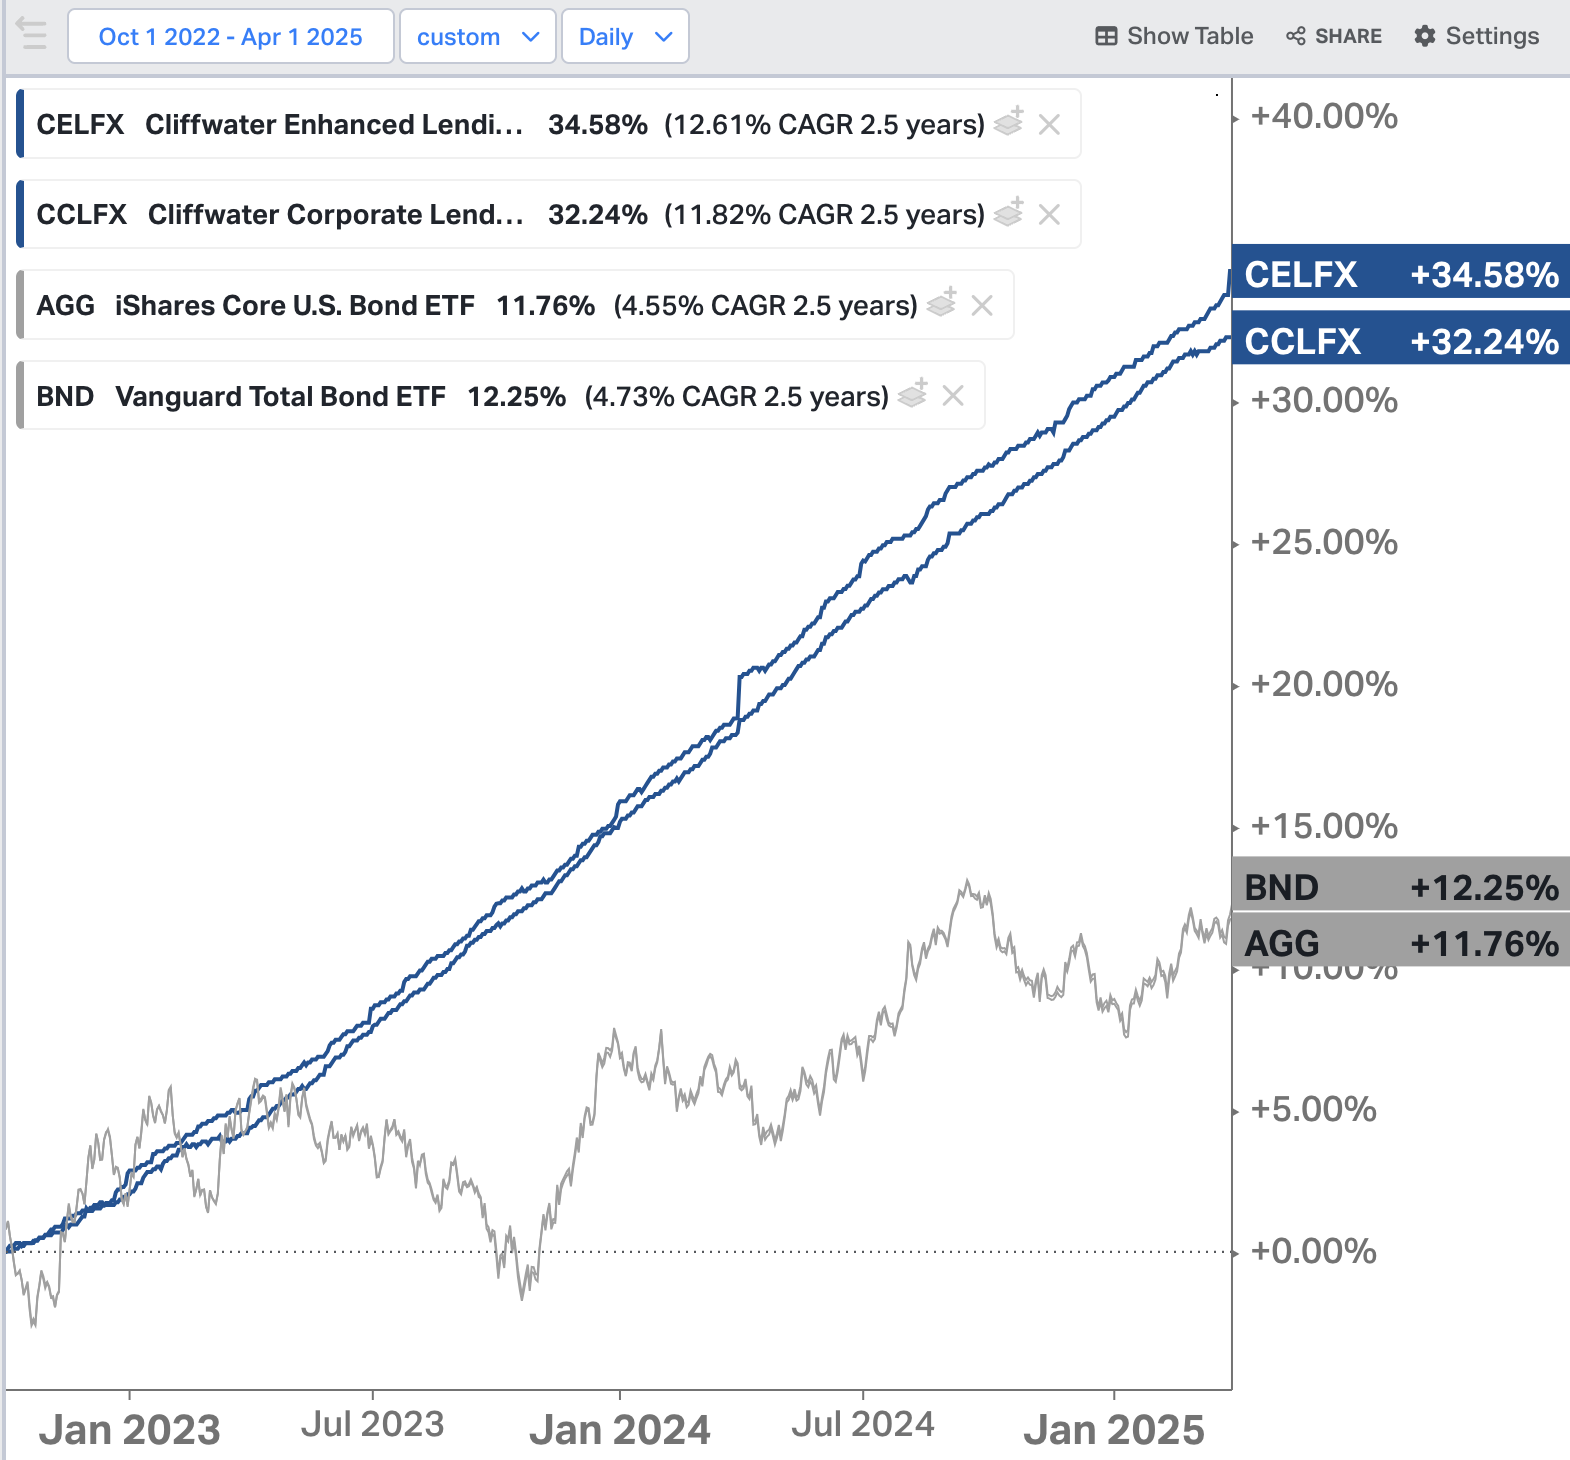
Private Credit
Over the last 20 years, Private Credit has outperformed US Core Bonds by +7% per year, returning six times more during that 20-year timeframe (520% total return vs 80% return). 3 Again, what's more more impressive is that excess return was not achieved by taking more risk. Since 2005, U.S. Core Bonds have been more volatile than Private Credit: U.S. Core Bonds had a 20-year max drawdown of -17% (in 2022), while Private Credit had a 20-year max drawdown of only -8% (in 2008). 5
From 2005-2024, over six times more total return, with half the risk of loss.
Learn More About Private Credit
1,2: Risk and returns statistics are from a 20-year period from 12/31/2004-12/31/2024. 2 3
Max loss shown is a quarterly max drawdown for each asset class during the same 20-year time period. 5
Paragon Investing provides access to Private Equity and Private Credit interval funds, the same investments that are owned by ultra-wealthy families, endowments, pensions, and other sophisticated investors with $100M+.
Certain interval funds restrict the types of investors that can participate, and these funds are selective in the advisors they choose to partner with. Paragon Investing has been approved to provide our clients with access.


Paragon's advisors spend hundreds of hours each year on original fund due diligence for new and upcoming opportunities, which historically has led us to select top-quartile funds, earning greater returns than most of our peers.
Paragon clients pay just one low fee, based on the amount of assets under advisement. This fee includes full access to every investment we offer and a dedicated investment advisor who will guide you through the entire process.
Private Credit and Private Equity have historically earned significantly higher returns than their publicly-traded equivalents.
(Time period 12/31/2004 - 12/31/2024)
Often referred to as the "illiquidity premium"
due to private investments having some degree of illiquidity (our selected interval funds offer daily buy-ins but only periodic redemptions).
Includes custom portfolio management and personalized financial planning.
Pricing and fees for Paragon Investing advisor services are based on a percentage of total assets under advisement (AUA).
Fees shown are on a per-year basis, but fees are calculated at the end of each quarter, based on average daily value for the quarter.
This pricing does not include fund fees (expense ratios), trading fees/commissions, transaction fees,
wire fees, or other Charles Schwab fees. Paragon’s only compensation is the advisor fee.


Learn more about our recommended Private Equity investments and the historical risk & return performance.
Learn more about how to transfer your money to Schwab and get started investing with Paragon today.
Learn more about our recommended Private Credit investments and the historical risk & return performance.
Interested in becoming a client? Have a question?
1. Private Equity funds such as CPEFX have a $25M minimum to access their fund. Private Credit funds such as CCLFX and CELFX have a $10M minimum to access their fund.
2. Public US Stocks: 10% [Russell 3000; IWV] (Period: 12/31/2004 - 12/31/2024), Private Equity: 15% [Cambridge Private Equity Index] (Reporting period: 9/30/2004 - 9/30/2024; Equivalent period for applied performance: 12/31/2004 - 12/31/2024). PE returns lag one quarter, even with daily priced interval funds. Returns rounded to the nearest whole number.
3. Public US Bonds: 3% [Core US Bond; AGG] (Period: 12/31/2004 - 12/31/2024), Private Credit: 10% [Cliffwater Direct Lending Index, CDLI] (Period: 12/31/2004 - 12/31/2024). Returns rounded to the nearest whole number.
4. Most Private Credit semi-liquid interval funds offer quarterly redemptions, while most Private Equity funds offer semi-annual redemptions (every 6 months), subject to proration if total redemption demand exceeds 5% of fund AUM on any date.
5. Max drawdown figures are quarterly max drawdowns for all asset classes. Sources: CAIA and MAN Group. Cambridge Associates U.S. Buyout sector experienced a -28% peak-to-trough NAV decline during the 2007–2009 global financial crisis. Cambridge Associates U.S. Venture Capital (VC) sector experienced a -17.5% peak-to-trough NAV decline during the 2008–2009 global financial crisis. Making a composite to represent our current investments, based on proportional allocations to US Buyout and US Venture Capital segments of the US Private Equity market: -28% * 75% allocation + -17.5% * 25% allocation = 25.3% (rounded down to -25% max drawdown in 2008-2009.
6. Chart Disclosures: The Paragon Model Portfolio has been tracked and updated at each month end since 12/31/2020, since inception of the firm in Q4 2020. Results do not represent actual trading, but most clients portfolios are traded in accordance with the model, subject to any personal modifications required. Performance shown is net of all fees, including a 0.60% advisory fee, deducted daily. The results assumes reinvestment of all dividends and distributions received. The Paragon Model Portfolio utilizes stocks, bonds, cash, including ETFs and mutual funds, and also heavily utilizes semi-liquid interval fund investments, some of which require accredited investor status, to gain exposure to private equity and private credit investments. Investors in interval funds can buy in daily but redemptions are limited to either quarterly or bi-annual dates. Any divestments from these semi-liquid funds in the Model are aligned to the closet month-end update in the Paragon Model Portfolio. This process allows for up to 15 days of discrepancy in returns. The 'Large Firm 60/40 Blend' includes the following funds: MIBLX (BNY Mellon), FBLAX (Fidelity), FPURX (Fidelity), OAMIX (Invesco), BAGPX (BlackRock), ABALX (American Funds), MDLOX (BlackRock), MXMPX (Empower), GAOAX (JPMorgan), EAAFX (Allspring), BPGLX (UBS).
7. Historically, large university endowments have invested heavily in the private and alternative asset space, with 80% allocations to private equity, venture capital, private credit, hedge funds, infrastructure, private real estate, real assets, and other alternative investments. Allocations to traditional assets including public stocks, bonds, and cash are typically in the 20% range. Sources: The University of Michigan Endowment has 80% in alternatives, 17% in stocks and bonds, and 3% in cash (as of June 30, 2025). The Harvard Endowment has 79% in Alternatives, 18% in stocks and bonds, and 3% in cash (as of June 30, 2025) [Source]. The Princeton Endowment has 76% in Alternatives, 20% in public stocks and bonds, and 4% in cash (as of June 30, 2025) [Source].
8. As of publication date (01/31/2026), both Paragon advisors (IARs) were invested in the recommended Private Equity and Private Credit funds at total allocations 82% and 74% of portfolio for each advisor, demonstrating significant personal alignment with recommendations given to clients. The remaining portfolio for both advisors is invested primarily in U.S. stocks and public equities, which is also aligned with the Paragon Model Portfolio, again demonstrating a high degree of alignment between advisor recommendations and our personal investments.
All investing involves risk, including the possible loss of money you invest. Past performance does not guarantee future performance. Historical returns, expected returns, and probability projections are provided for informational and illustrative purposes, and may not reflect actual future performance. Please see our Full Disclosure for important details.
Copyright © Paragon Investing. All Rights Reserved. Privacy Policy. Terms of Use. Form ADV and Part 2. RIA and IAR Registration.