Full Disclosure
Revised June 2, 2023
General Disclosures
Paragon Investing, LLC ("Paragon Investing" or "Paragon") is a Registered Investment Advisor offering advisory services in the State(s) of Michigan and in other jurisdictions where exempted. Paragon Investing and its affiliates operate a website at www.paragoninvesting.com and/or our mobile applications ("our website" (which includes our blog), "our app" or "Paragon"). Registration does not imply a certain level of skill or training. The presence of this website on the Internet shall not be directly or indirectly interpreted as a solicitation of investment advisory services to persons of another jurisdiction unless otherwise permitted by statute. Follow-up or individualized responses to consumers in a particular state by Paragon Investing in the rendering of personalized investment advice for compensation shall not be made without our first complying with jurisdiction requirements or pursuant an applicable state exemption.
Paragon Investing provides investment advisory services to clients, but does not provide personalized estate planning, tax, trusts, or other related services. Nothing on this Site or App should be construed as a solicitation or offer, or recommendation, to buy or sell any security. Advisory services are only provided to investors who become advisory clients of Paragon Investing ("Clients") pursuant to a written & signed Client Advisory Agreement, which investors are urged to read and carefully consider in determining whether such agreement is suitable for their individual facts and circumstances.
PAST PERFORMANCE IS NO GUARANTEE OF FUTURE RESULTS, AND ANY EXPECTED RETURNS OR HYPOTHETICAL PROJECTIONS MAY NOT REFLECT ACTUAL FUTURE PERFORMANCE. FURTHERMORE, PAST RETURNS MAY REFLECT THE PERFORMANCE OF ASSETS FOR A FINITE TIME, OR DURING A PERIOD OF EXTREME MARKET ACTIVITY. ALL INVESTMENTS INVOLVE RISK AND MAY LOSE MONEY. There can be no assurance that an investment mix or any projected or actual performance shown on the Site or App will lead to the expected results shown or perform in any predictable manner. It should not be assumed that investors will experience returns in the future, if any, comparable to those shown or that any or all Clients actually experienced such returns.
Information presented is for educational purposes only and does not intend to make an offer or solicitation for the sale or purchase of any securities. Past performance is not indicative of future results and investments involve risk and are not guaranteed. Be sure to first consult with a qualified financial adviser and/or tax professional before implementing any strategy discussed here.
The charts and information in this presentation are for illustrative purposes only, and are based upon sources of information that Paragon Investing generally considers reliable, however we cannot guarantee, nor have we verified, the accuracy of such independent market information. The charts and information, and the sources utilized in the compilation thereof, are subjective in nature and open to interpretation.
All investing involves risk, including the possible loss of money you invest, and past performance does not guarantee future performance. Historical returns, expected returns, and probability projections are provided for informational and illustrative purposes, and may not reflect actual future performance.
The information on this site is provided “AS IS” and without warranties of any kind either express or implied. To the fullest extent permissible pursuant to applicable laws, Paragon Investing disclaims all warranties, express or implied, including, but not limited to, implied warranties of merchantability, non-infringement and suitability for a particular purpose. Paragon Investing does not warrant that the information will be free from error. None of the information provided on this website is intended as investment, tax, accounting or legal advice, as an offer or solicitation of an offer to buy or sell, or as an endorsement of any company, security, fund, or other securities or non-securities offering. The information should not be relied upon for purposes of transacting securities or other investments. Your use of the information is at your sole risk. Under no circumstances shall Paragon Investing be liable for any direct, indirect, special or consequential damages that result from the use of, or the inability to use, the materials in this site, even if Paragon Investing or a Paragon Investing authorized representative has been advised of the possibility of such damages. In no event shall Paragon Investing, LLC have any liability to you for damages, losses and causes of action for accessing this site. Information on this website should not be considered a solicitation to buy, an offer to sell, or a recommendation of any security in any jurisdiction where such offer, solicitation, or recommendation would be unlawful or unauthorized.
This website contains the opinions of Paragon Investing, a Registered Investment Advisor. This information should not be relied upon for tax purposes and is based upon sources believed to be reliable. No guarantee is made to the completeness or accuracy of this information. Paragon Investing shall not be responsible for any trading decisions, damages, or other losses resulting from, or related to, the information, data, analyses or opinions contained herein or their use, which do not constitute investment advice, are provided as of the date written, are provided solely for informational purposes, and therefore are not an offer to buy or sell a security. Investments in securities are subject to investment risk, including possible loss of principal. Prices of securities may fluctuate from time to time and may even become valueless. This information has not been tailored to suit any individual.
All written content on this site is for information purposes only. Opinions expressed herein are solely those of Paragon Investing, unless otherwise specifically cited. Material presented is believed to be from reliable sources and no representations are made by our firm as to another parties’ informational accuracy or completeness. All information or ideas provided should be discussed in detail with an advisor, accountant or legal counsel prior to implementation.
All product names, logos, and brands are property of their respective owners. Use of these names, logos, and brands is for identification purposes only, and does not imply endorsement or affiliation.
Performance Disclosures
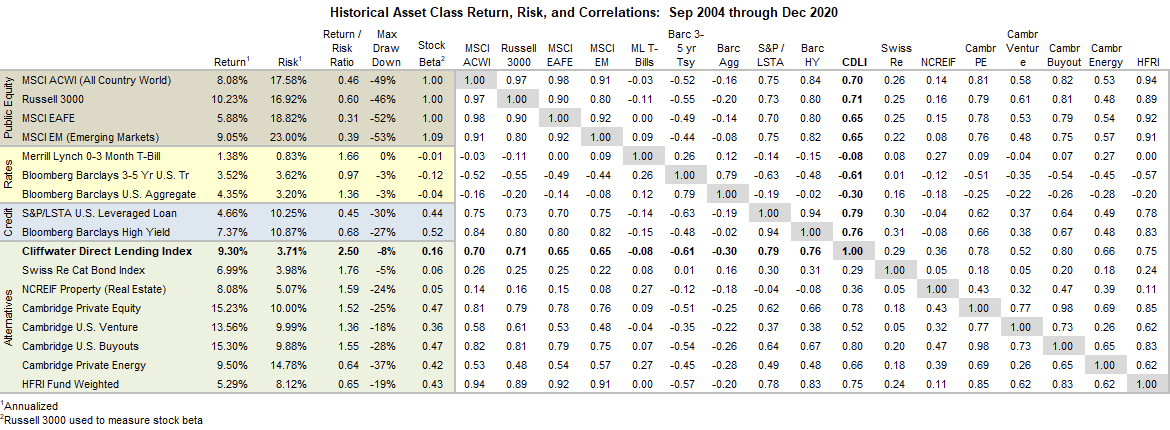
Asset Class Historical Performance is taken from the below chart, updated annually by Cliffwater. Latest data as of 12/31/2022.

Source: Cliffwater's Historical Asset Class Return & Risk 2004-2022. Cliffwater Direct Lending Index (CDLI) represents the Private Debt and Direct Lending asset class. S&P LSTA US Leveraged Loan represent public debt. Barclays US Aggregate Bond represents public Bonds. Illiquidity return premium is the difference between CDLI and the two public indexes.
Notes: 09/30/2004-3/31/2023 return data, except for PE data is as of 12/31/2022.
Monthly return data for Index ETFs from Koyfin. Quarterly return data from CDLI website.
The example portfolio is for illustrative purposes only, to show the benefit of adding a private debt allocation to portfolios. It is not representative of Paragon Investing's current strategic nor tactical recommendations.
Historical performance utilizes low-fee index ETFs such as IWV, IWM, SPY, IAU, VNQ, EFA, EEM, AGG, JNK, plus the Cliffwater Direct Lending Index (CDLI), and the Cambridge Associate U.S. Private Equity Index, both priced quarterly, to demonstrate the impact of broad asset allocation adjustments on risk and return.
Low-fee index ETFs are used to represent traditional stock and bond asset classes, plus Real Estate & Gold, while Cliffwater Direct Lending Index (10,000+ loans with $100B+ in current value) is used to represent the Private Debt asset class. Client portfolio implementation may utilize different managers, and tactical targets may be used to adapt to the current market environment and liquidity considerations.
** This is an index of private loans with data since 9/30/2004. The CDLI Index is unlevered, while some current private debt funds use some amount of leverage, up to 1.0x. No fund manager fee is deducted for CDLI, because in practice the fund manager fee is offset by a small amount of fund leverage, increasing the gross return for the fund. On a net basis, the total return from funds is near to the CDLI return.Details here.
Investment Performance Backtest
The performance shown represents the backtested results of Paragon Investing's strategic targets for the relevant time period and do not represent the results of actual trading of investor assets. Backtest performance has inherent limitations. The results are theoretical and do not reflect any investor’s actual experience with owning, trading or managing an actual investment account. Thus, the performance shown does not reflect the impact that material economic and market factors had or might have had on decision making if actual investor money had been managed.
Investment performance shown does NOT include the Paragon advisory fee, and nor does it consider trading costs or any other costs, including but not limited to brokerage fees, custodial fees and additional fees and expenses. Performance results shown include the reinvestment of dividends and interest, and interest on cash balances where applicable. The data used to calculate the investment performance was obtained from sources deemed reliable and then organized and presented by Paragon Investing.
The performance calculations have not been audited by any third party. Actual performance of client portfolios may differ materially due to the timing related to additional client deposits or withdrawals and the actual deployment and investment of a client portfolio, the reinvestment of dividends, the length of time various positions are held, the client’s objectives and restrictions, and fees and expenses incurred by any specific individual portfolio.
The results do not represent actual trading and actual results may significantly differ from the theoretical results presented. Past performance is not indicative of future performance.
Backtested Performance Disclosure
Backtested performance is NOT an indicator of future actual results. There are limitations inherent in hypothetical results particularly that the performance results do not represent the results of actual trading using client assets, but were achieved by means of retroactive application of a backtested portfolio that was designed with the benefit of hindsight. The results reflect performance of a strategy not historically offered to investors and do NOT represent returns that any investor actually attained. Backtested results are calculated by the retroactive application of a portfolio constructed on the basis of historical data and based on assumptions integral to the portfolio which may or may not be testable and are subject to losses.
Backtested performance is developed with the benefit of hindsight and has inherent limitations.
Specifically, backtested results do not reflect actual trading, or the effect of material economic and market factors on the decision making process, or the skill of the adviser. Since trades have not actually been executed, results may have under- or over-compensated for the impact, if any, of certain market factors, such as lack of liquidity, and may not reflect the impact that certain economic or market factors may have had on the decision-making process. Further, backtesting allows the security selection methodology to be adjusted until past returns are maximized. Actual performance may differ significantly from backtested performance.
Disclosure
Paragon Investing is a registered investment adviser. Information presented herein is for educational purposes only and does not intend to make an offer or solicitation for the sale or purchase of any specific securities, investments, or investment strategies. Investments involve risk and unless otherwise stated, are not guaranteed. Past performance is not indicative of future performance.
Readers of the information contained on this site should be aware that any action taken by the viewer/reader based on this information is taken at their own risk. This information does not address individual situations and should not be construed or viewed as any typed of individual or group recommendation. Be sure to first consult with a qualified financial adviser, tax professional, and/or legal counsel before implementing any securities, investments, or investment strategies discussed.
1.55% Increased Returns Target
- The target of 1.55% net outperformance or increased returns is calculated by using the +2.0% gross outperformance calculated below, less the 0.45% advisor fee for our Access-Only service, for $5.0M in assets under advisement.
50% Outperformance Over 30 Years Disclosures
- The claim of achieving 50% outperformance over 30 years is calculated using a 2.0% annual outperformance, gross of fee (before advisor fee), reduced by a 0.60% advisor fee, for a net 1.40% outperformance, compounded over 30 years, results in a 51.75% outperformance over 30 years. Rounded down to 50%.
- The 2.0% gross outperformance is calculated by:
- Using Private Debt funds over commonly-used 10-yr Treasury and Investment Grade (IG) Bonds in a 55/45 or 50/50 risk portfolio.
- +4.5% outperformance expected return for private debt over commonly-used IG corporate bonds (same annual volatility risk, see below table).
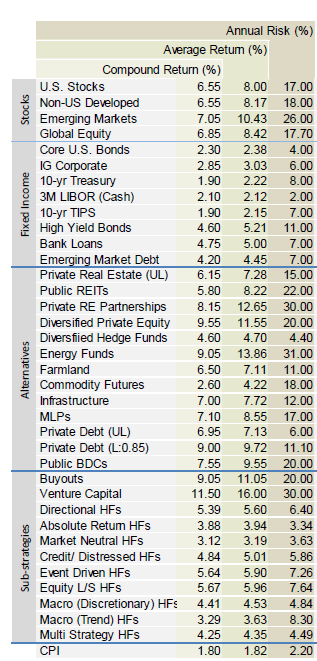
- Private Debt expected return of 7.13% (Cliffwater)
- Treasury Bonds expected return of 2.22% (see below table)
- IG Corporate Bonds expected return of 3.03% (see below table)
- Average Treasury + IG Corporate Bonds expected return of 2.62%
- Both have expected volatility of 6.0% (Treasuries actually 8.0%)
- Return delta is 7.13% - 2.62% = 4.51%
- +4.5% * 45% portfolio allocation = +2.025% at portfolio level (rounded down).
- Further references:
- Ref: BlackRock's 5-10 Year Expected Asset Class Returns
- Ref: Cliffwater Direct Lending Index (CDLI)
Cliffwater Q12020 Long Term (10 Year) Capital Market Assumptions

Source: Cliffwater Q12020 Long Term (10 Year) Capital Market Assumptions
Reduced Volatility - Disclosure
Due to the historic relative outperformance of private debt funds over public IG bonds, which is also expected to continue into the near future, per above, this allows Paragon to construct an equivalent expected return with lower volatility, by lowering the portfolio's overall allocation to equities.
Whereas the traditional portfolio might be 70% equities and 30% IG bonds, the Paragon portfolio would be 50% equities, 30% private debt, and 20% IG bonds, for example.
This 50/30/20 portfolio is expected to keep pace with the traditional 70/30 portfolio, but with 20% or more lower volatility and risk. Example calculations below, using data from 2004-2019, source below:
Traditional 70/30 Portfolio:
- 70% MSCI ACWI - 7.55% return and 16.13% volatility
- 30% Barclays U.S. Agg Bond - 4.15% return and 3.23% volatility
- Compounded return: 6.34%
- Compounded volatility: 11.30%
- 50% MSCI ACWI - 7.55% return and 16.13% volatility
- 30% CLDI - 9.55% return and 3.32% volatility
- 20% Barclays U.S. Agg Bond - 4.15% return and 3.23% volatility
- Compounded return: 7.34% (+1.00% over 70/30)
- Compounded volatility: 8.60% (-2.7% under 70/30)
 Source: Cliffwater Asset Class Return & Risk 2004-2020. Cliffwater Direct Lending Index represents private debt. S&P LSTA US Leveraged Loan represents public debt. Illiquidity return premium is the difference between the two indexes.
Private Debt Illiquidity Return Premium & Reduced Volatility - Disclosure
Private Debt as an asset class, represented by the Cliffwater Direct Lending Index (CDLI), below, has historically (last 19 years) demonstrated an illiquidity return premium of 6.3% over S&P/LSTA U.S. Leverage Loans Index (the public market counterpart).
Further, Private Debt as an asset class, represented by the Cliffwater Direct Lending Index (CDLI), below, has historically (last 15 years) demonstrated 65% lower volatility (3.32% vs 9.63%) when compared to the S&P/LSTA U.S. Leverage Loans Index (the public market counterpart). See below.

Source: Cliffwater Asset Class Return & Risk 2004-2022. Cliffwater Direct Lending Index represents private debt. S&P LSTA US Leveraged Loan represents public debt. Illiquidity return premium is the difference between the two indexes.
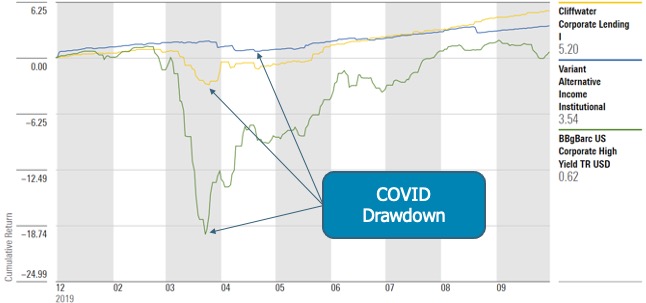
Private Debt - Max Drawdown During COVID (2020)
 Source: Morningstar Direct
Private debt investments such as Cliffwater (CCLFX) and Variant (NICHX) had COVID daily draw-downs of 4.0% and 2.0%, respectively. This is compared to the Bloomberg Barclays Corporate High Yield index which drew down 21.0% during COVID.
Further Charts, Tables, and Supporting Data
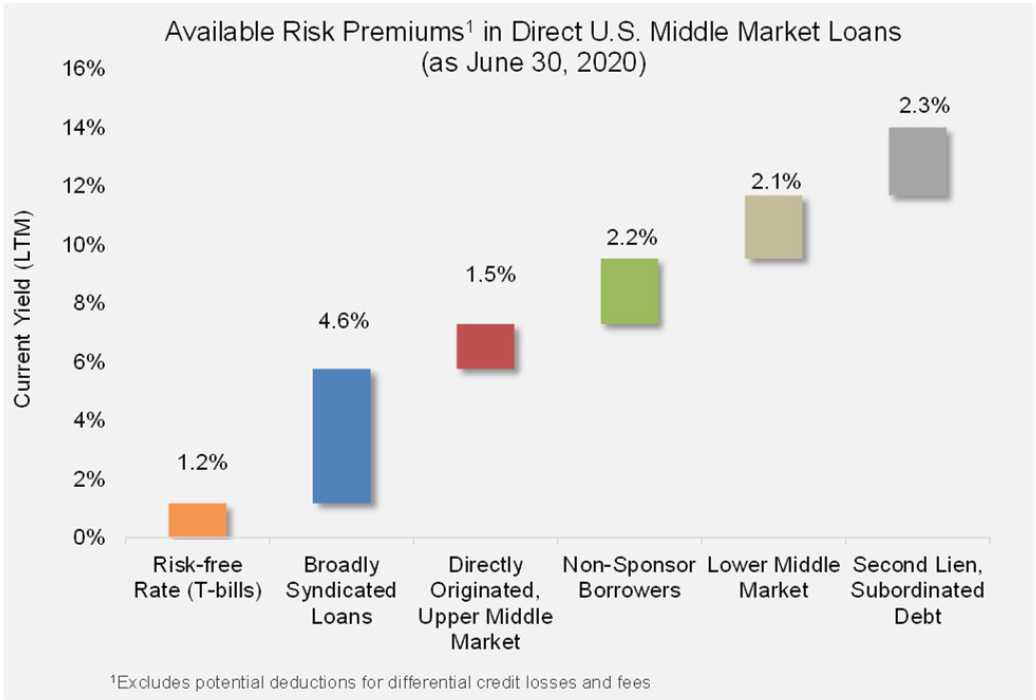
Taken From Cliffwater 2020 Q2 Report On US Direct Lending:
 (2004-2020).png) Return consistency, one neg calendar year.
Return consistency, one neg calendar year.
 Risk/Illiquidity premiums.
.png) Return consistency, one neg calendar year.
Return consistency, one neg calendar year.
Sources:
- Cliffwater Direct Lending Index (CDLI)
- Cliffwater Capital Market Assumptions (2020-2030)
- Cliffwater Funds (CCLFX & CELFX)
- Cliffwater indexes
- Blackrock Capital Market Assumptions (2023-2032)
- Blackrock Strategic Asset Allocation
- Cliffwater 2023 Q1 Report On US Direct Lending
Note: Cliffwater's research is based on public information and confidential responses of direct lending managers to Cliffwater inquiries.