hidden
-

Adding
Private Equity
To Your Portfolio
Historically offers high returns and moderate risk
What is Private Equity?
Private Equity (PE) refers to buying stock or equity ownership in a privately-held corporation. Similar to buying stocks on the public stock market, except these private companies do not trade on an exchange. Which makes buying and selling shares more challenging, and the lack of access creates attractive investment opportunities.
Of the US corporations with $100M+ in revenue, over 87% are privately held.3 Over 215,000 companies globally have private equity or venture capital backing. Private equity and venture capital assets under management topped $11 trillion at the end of 2023.
So, why invest in Private Equity?
Comparing 20-year Returns: Private Equity vs S&P 500
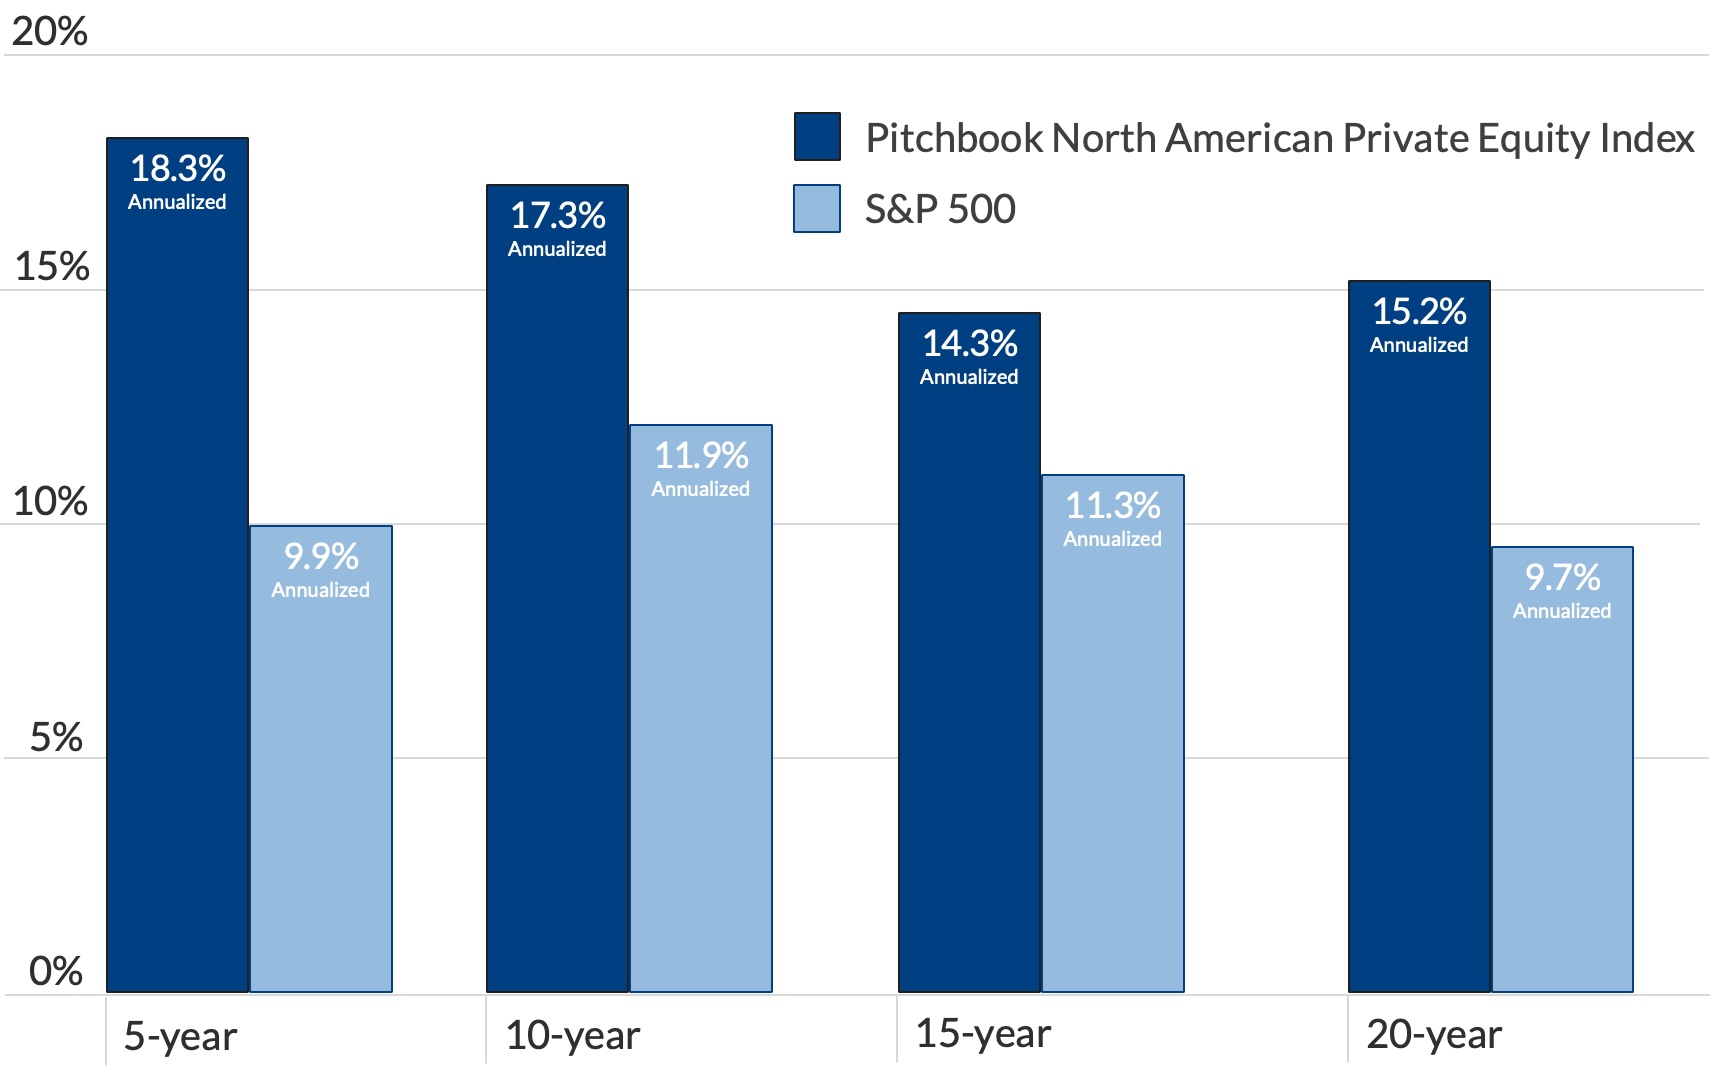
Source: Pitchbook, as of December 31, 2023 Retrieved 3/31/2025. Alternate source: Cambridge Private Equity Index Retrieved 3/31/2025.
Higher returns
For the last 20+ years, Private Equity as an asset class has generated returns of 15% annualized. Compare this to 20-year returns for US Stocks (S&P 500) of approximately 10% over the same period. 2
Private Equity has outperformed by +5% per year for over 20 years, 2 with no signs of stopping or slowing. In fact, the outperformance has only widened in recent years, with the latest 5-year outperformance close to +8% annualized (2019-2023).
Over the next 20 year period, if the 15% and 10% returns repeat themselves, then Private Equity will nearly triple the return of US Stocks over the next 20 years (1536% return vs 572% return).
Lower risk of loss
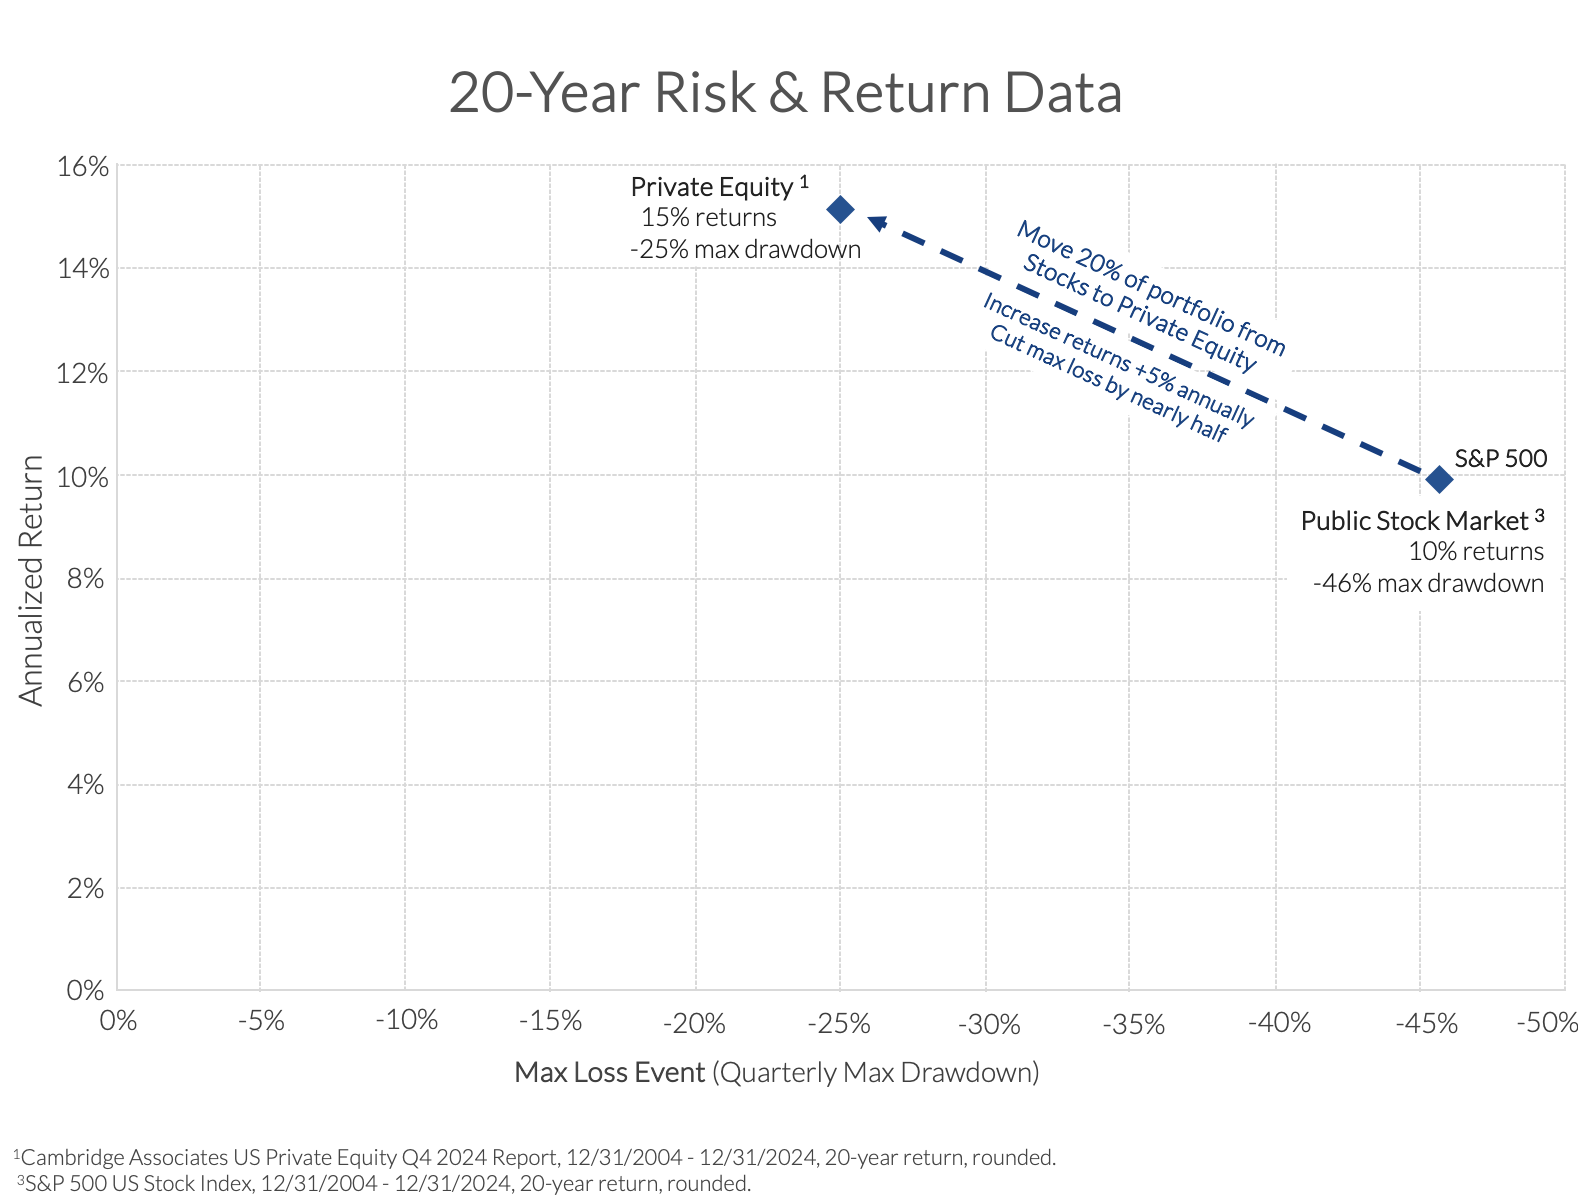
Compared to the public stock market, Private Equity has historically offered lower risk, about half the volatility of the public stock market index. A regression analysis of historical data shows the Private Equity index has a 0.42 beta to the Russell 3000 (US all-caps index), with another study finding PE has a 0.50 beta to the S&P 500.
Sources: Cliffwater research, as of June 30, 2023. Period Q1 2006 – Q2 2023. and State Street Advisors (2019)
Perhaps more importantly, in the last three major crashes and bear markets (2008, 2020, 2022) Private Equity has experienced only half of the max drawdown when compared to the public stock market indexes. For example, in 2008, the largest recent crash, Private Equity was down -25% at the lowest point, while US stocks indexes were down around -46% at their lowest point (quarterly max drawdown).
Less liquidity
As they say: "there's no such thing as a free lunch", and Private Equity does have its drawbacks. As the name implies, Private Equity investments are privately held companies and do not trade on an exchange the way public stocks do. So the mutual funds that hold Private Equity investments are naturally less liquid as well.
There are now 20+ different Private Equity mutual funds that offer periodic, capped liquidity via a tender fund or interval fund structure. These mutual fund vehicles offer daily buy-ins, daily pricing, and quarterly or semi-annual redemptions of at least 5% of the fund's total assets each period. As a mutual fund, these funds must follow all the SEC rules on reporting, pricing, and audits -- offering much more transparency than a typical opaque LP structure.
The Private Equity pitch: give up liquidity in exchange for higher returns and lower risk
Our preferred funds
Our target at Paragon is to select top-quartile funds, achieving top 25% performance for both return and risk, relative to their peers. With the ultimate goal being to outperform both equivalent-risk peers and the broader Private Equity asset class index (Cambridge, Pitchbook) regardless of the current market dynamic.
Below is a chart showing recent performance of our preferred Private Equity funds (first recommended 3/15/2024).
- Our Private Equity funds: +28% annualized (rounded)
- Public US Stock Indexes: +20% annualized (average, rounded)
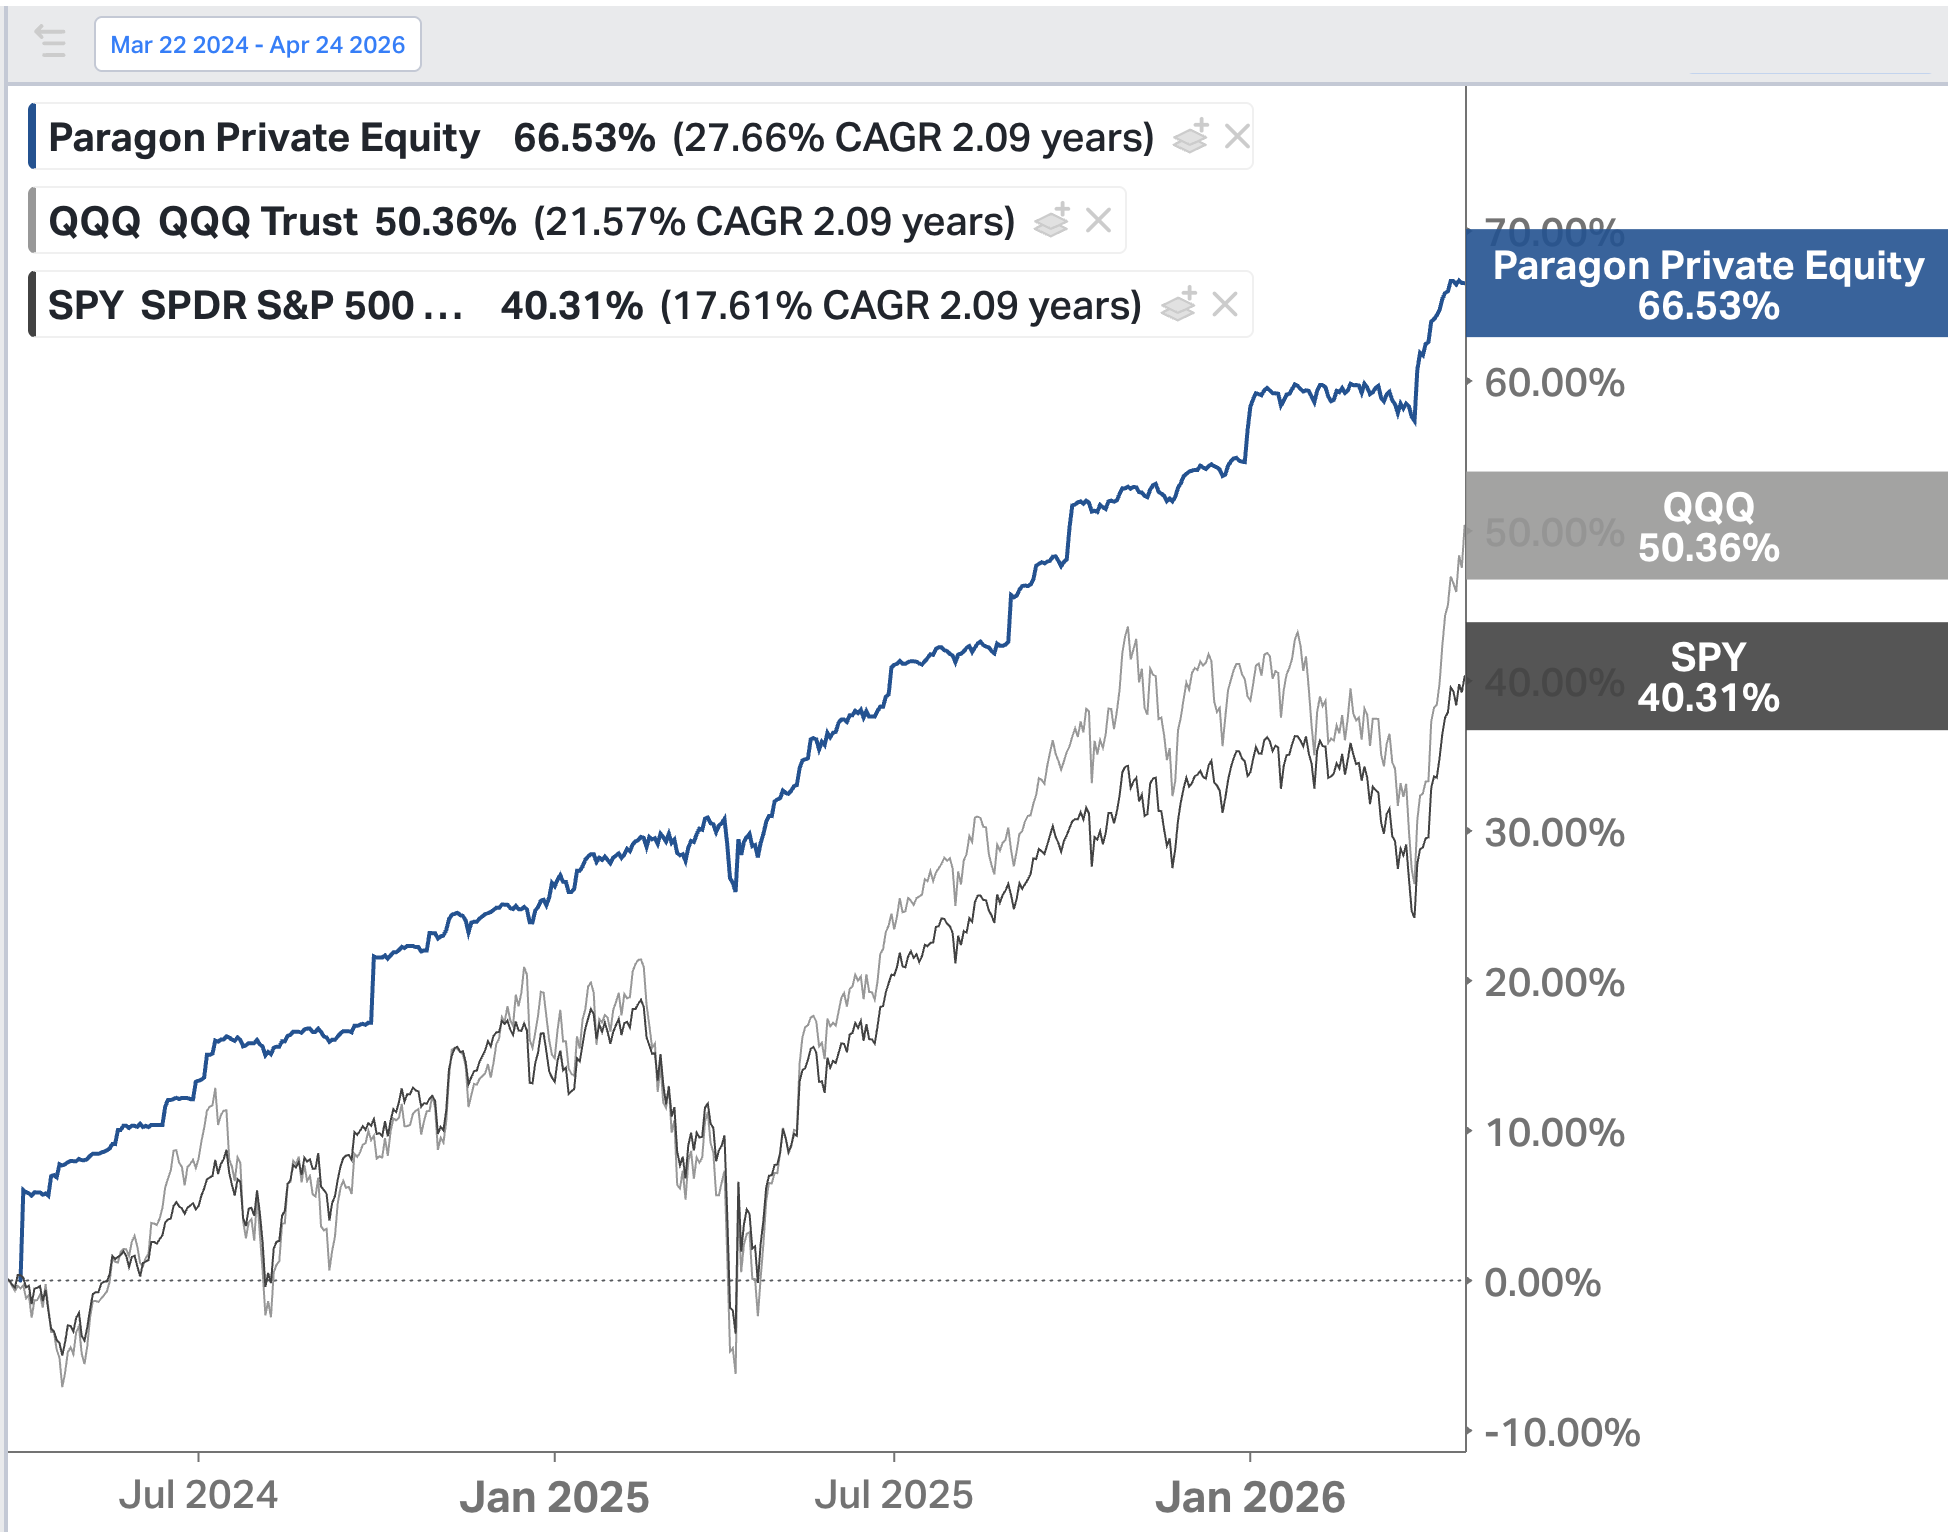
Source: Koyfin.com, retrieved 04/24/2026
Bottom line
If you are willing to accept some semi-liquidity on a portion of your portfolio, Private Equity offers the highest expected returns of any major asset class, driven by strong fundamentals, not short-term trends. Private Equity also offers lower risk than public stock markets.
Paragon recommends an allocation of 25-30% to Private Equity in your portfolio.
Trade liquidity for performance
- Enhanced Returns: Private Equity has historically outperformed the public stock market by +5.0% annually over the last 20 years 1.
- Reduced Volatility: In 2022, when US stock and bond indexes were down -24% and -17%, respectively, the US Private Equity index was only down -5.7% for all of 2022. The precursor to our current Private Equity fund (CPEFX), was only down -5.0% at the lowest point, and full recovered -- ending the year with a positive +12.1% return for CY 2022.
- Semi-Annual Liquidity: Historically, Private Equity has been a fully illiquid asset class. But by using interval funds, clients receive the opportunity to request their money out twice a year.
Better performance through independent research, deep due diligence, and exclusive access.

1. Private Equity funds such as CPEFX have a $25M firm minimum to access their fund.
2. Public US Stocks: 10% [Russell 3000; IWV] (Period: 12/31/2004 - 12/31/2024), Private Equity: 15% [Cambridge Private Equity Index] (Reporting period: 9/30/2004 - 9/30/2024; Equivalent period for applied performance: 12/31/2004 - 12/31/2024). PE returns lag one quarter, even with daily priced interval funds. Returns rounded to the nearest whole number.
3. "Approximately 87% of U.S. companies that generate $100M+ in revenue are privately held. " (Source: *Source: S&P Capital IQ, Apollo Chief Economist. Note: For companies with last 12-month revenue greater then $100 million by count). Source: Investment News
4. Private Equity funds offer semi-annual redemptions (every 6 months), subject to proration if total redemption demand exceeds 5% of fund AUM.
5. Max drawdown figures are quarterly max drawdowns for all asset classes. Sources: CAIA and MAN Group. Cambridge Associates U.S. Buyout sector experienced a -28% peak-to-trough NAV decline during the 2007–2009 global financial crisis. Cambridge Associates U.S. Venture Capital (VC) sector experienced a -17.5% peak-to-trough NAV decline during the 2008–2009 global financial crisis. Making a composite to represent our current investments, based on proportional allocations to US Buyout and US Venture Capital segments of the US Private Equity market: -28% * 75% allocation + -17.5% * 25% allocation = 25.3% (rounded down to -25% max drawdown in 2008-2009.
6. Chart Disclosures: The Paragon Model Portfolio has been tracked and updated at each month end since 12/31/2020, since inception of the firm in Q4 2020. Results do not represent actual trading, but most clients portfolios are traded in accordance with the model, subject to any personal modifications required. Performance shown is net of all fees, including a 0.60% advisory fee, deducted daily. The results assumes reinvestment of all dividends and distributions received. The Paragon Model Portfolio utilizes stocks, bonds, cash, including ETFs and mutual funds, and also heavily utilizes semi-liquid interval fund investments, some of which require accredited investor status, to gain exposure to private equity and private credit investments. Investors in interval funds can buy in daily but redemptions are limited to either quarterly or bi-annual dates. Any divestments from these semi-liquid funds in the Model are aligned to the closet month-end update in the Paragon Model Portfolio. This process allows for up to 15 days of discrepancy in returns. The 'Large Firm 60/40 Blend' includes the following funds: MIBLX (BNY Mellon), FBLAX (Fidelity), FPURX (Fidelity), OAMIX (Invesco), BAGPX (BlackRock), ABALX (American Funds), MDLOX (BlackRock), MXMPX (Empower), GAOAX (JPMorgan), EAAFX (Allspring), BPGLX (UBS).
All investing involves risk, including the possible loss of money you invest. Past performance does not guarantee future performance. Historical returns, expected returns, and probability projections are provided for informational and illustrative purposes, and may not reflect actual future performance. Please see our Full Disclosure for important details.
Copyright © Paragon Investing. All Rights Reserved. Privacy Policy. Terms of Use. Form ADV and Supplement. RIA and IAR Registration.